|

GBP/USD - Yield differential favors USD, bull flag on charts

  • Yield differential favors downside in the GBP/USD pair.
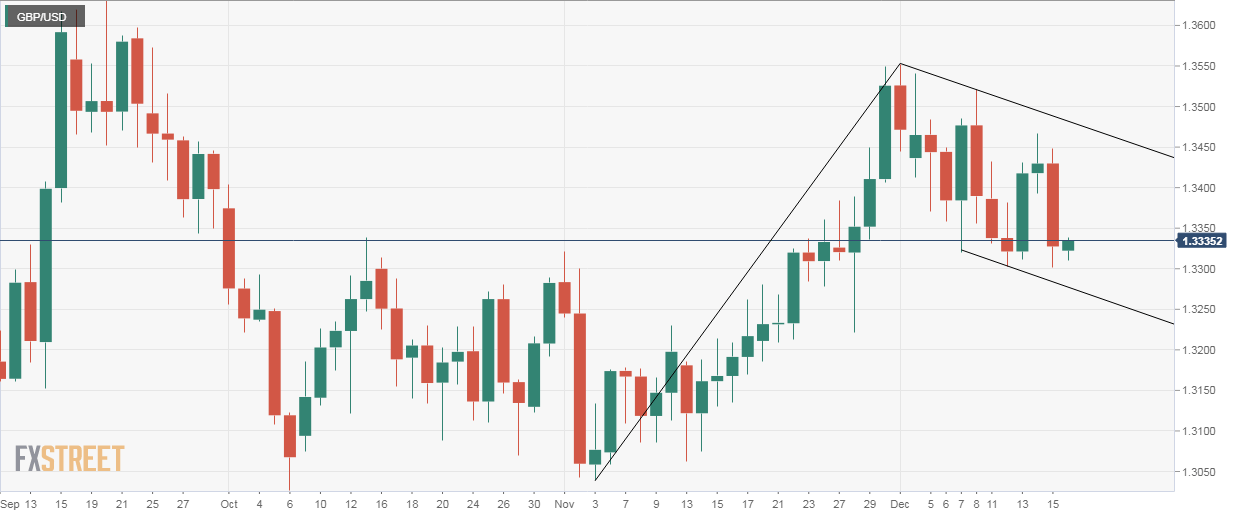
  • Still, the bull flag pattern on the daily chart keeps GBP bulls in the game.

GBP/USD fell sharply on Friday from 1.3448 to 1.3301 as US tax optimism strengthened the bid tone around the US dollar.

Currently, the 10-year US-UK bond yield differential stands at 122 basis points (bps); the highest level since Jun. 12. The rising yield spread adds credence to the lower highs pattern seen on the daily chart and indicates scope for a drop to 50-day MA of 1.3263. Also, short-term UK-US rate differential crashed to new YTD lows on Friday.

Still, all is not lost for the bulls as the daily chart shows a bull flag pattern. An upside break could revive the rally from the Nov. 13 low of 1.3062.

Focus on Brexit deal

Mario Blascak, Chief European Analyst at FXStreet, writes, "The shape of the Brexit deal is by far most important factor for the currency market. This is also what the bank of England has been saying in its December policy statement."

He adds, "With all the important events this year over, the GBP/USD is likely to remain within the broader range of $1.3210-$1.3450 for extended, pre-Christmas and post New Year period of time."

GBP/USD Technical Levels

FXStreet Chief Analyst Valeria Bednarik writes, "the daily chart for the pair shows that technical indicators have turned sharply lower, entering bearish territory, but also that the price holds far above its 100 and 200 SMAs, with the shortest now around 1.3230. Shorter term, and according to the 4 hours chart, the risk has lean towards the downside, as technical indicators entered negative territory, although with the downward momentum easing, while the decline accelerated on a break below the 100 SMA, and neared the 200 SMA, now a relevant support at 1.3285.

Support levels: 1.3310 1.3285 1.3230

Resistance levels: 1.3360 1.3400 1.3445
Author

Omkar Godbole

Omkar Godbole

FXStreet Contributor

Omkar Godbole, editor and analyst, joined FXStreet after four years as a research analyst at several Indian brokerage companies.


More from Omkar Godbole
Share:

Editor's Picks

AUD/USD rejected at 0.70 as hot US CPI revived Fed hike threat

The Aussie Dollar ends Wednesday’s session with a 0.17% loss against the US Dollar, as high US inflation sent US yields higher amid expectations that the Federal Reserve may hike rates late this month. The AUD/USD trades at 0.6971 after hitting a high above 0.7000.

USD/JPY slides back below 158.00 as USD reverses post-CPI gains

USD/JPY extends the previous day's pullback from a three-week high, attracting follow-through selling and sliding below 158.00 during Thursday's Asian session. Traders remain on high alert amid speculation that authorities will step in to prop up the Japanese Yen. The US Dollar, meanwhile, reverses Wednesday's hot CPI-led gains to April 2025 highs as US bond yields retreat, further pressuring the currency pair.

Gold recovers to $4,150 as retreating US bond yields weigh on USD

Gold attracts strong buying during the Asian session on Thursday, snapping a three-day losing streak to a one-week low. Retreating US bond yields drag the US Dollar away from the April 2025 high, touched in reaction to Wednesday’s hot US CPI report, and boost the non-yielding bullion. That said, energy-driven inflation risks keep bets of a Fed rate hike firmly on the table, which should cap the precious metal.

Bitcoin falls on hot CPI: Why $80,000 support matters

Bitcoin's (BTC) most critical level to watch is near $80,000 as September's hot inflation reading pressures the crypto market, according to Glassnode. The top crypto declined within minutes of the September Consumer Price Index (CPI) release, which showed a 3.7% annual increase in headline inflation, above forecasts of 3.6%. Core inflation, which excludes food and energy prices, came in at 2.6%.

Stock futures just went red on the CPI. Here's what the bond market is pricing that equities haven't caught up to

Since late June, the bond market has been pricing in a Federal Reserve that keeps raising rates into 2027, and most US stocks have already been marked down for it. The S&P 500 hasn't, because a handful of AI-linked giants make up much of the index and their prices haven't followed the rest.

Has Bitcoin really escaped the macro forces it was built to fight?
Over 17 years ago, Satoshi Nakamoto designed Bitcoin (BTC) on the back of a global financial crisis as an alternative to the global monetary system outside the control of central banks, governments and traditional intermediaries. This raises a key question: has Bitcoin really become independent of the macroeconomic forces it was built to challenge?
GBP/USD - Yield differential favors USD, bull flag on charts















