GBP/USD Technical Analysis: Skidding across the floor at 1.2700
- The GBP/USD is trading stiffly into the 1.2700 technical barrier heading into Wednesday's London market session after seeing continuing Brexit declines, and the near-term pattern is lending itself to fast sell-offs followed by middling inaction.
- GBP/USD Forecast: Sterling trapped in a downward spiral near a 10-week low
- GBP/USD Forecast: Likely to defend YTD lows ahead of BoE’s Super Thursday
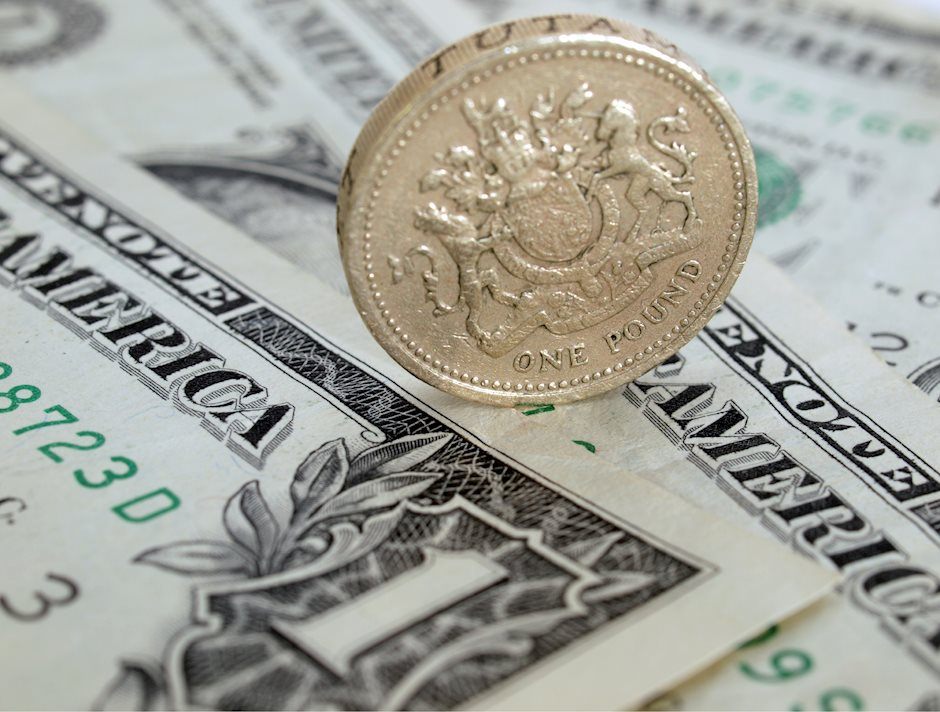
GBP/USD, M15
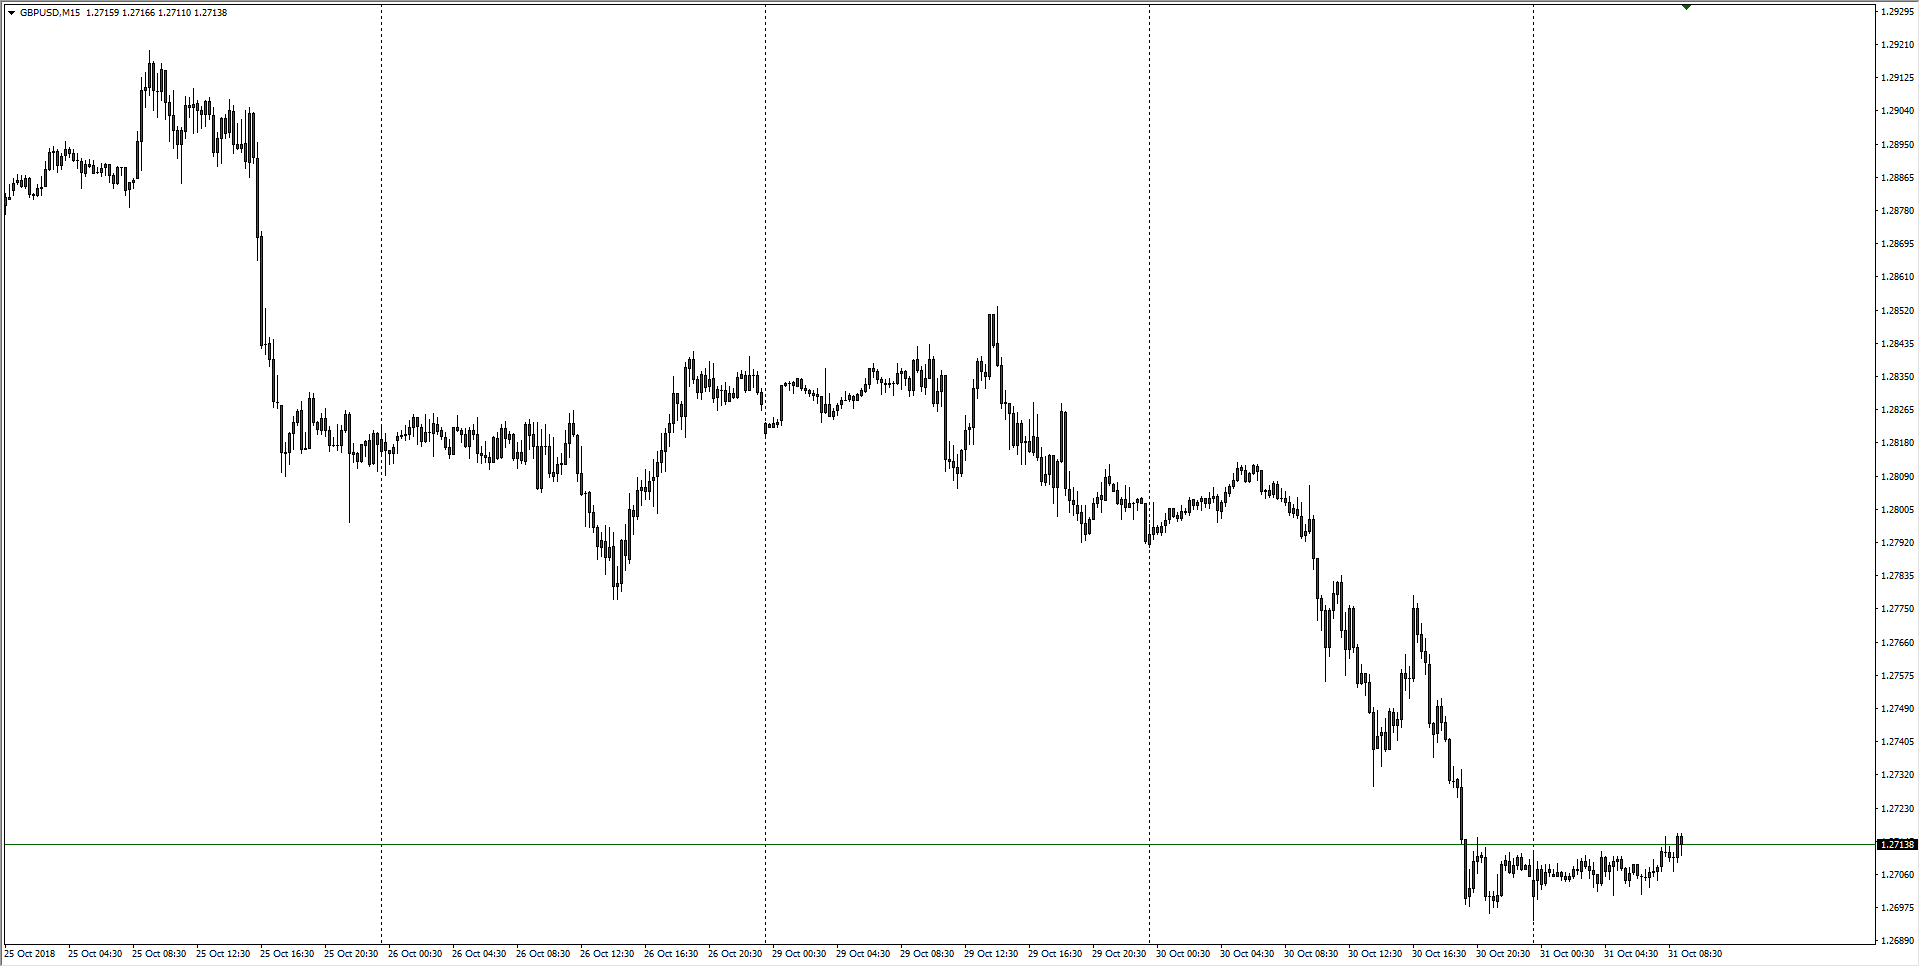
- Looking further out, the Cable remains underneath a rock-solid declining trendline with the 50- and 200-hour moving averages pinned firmly in a bearish trend.
GBP/USD, H1
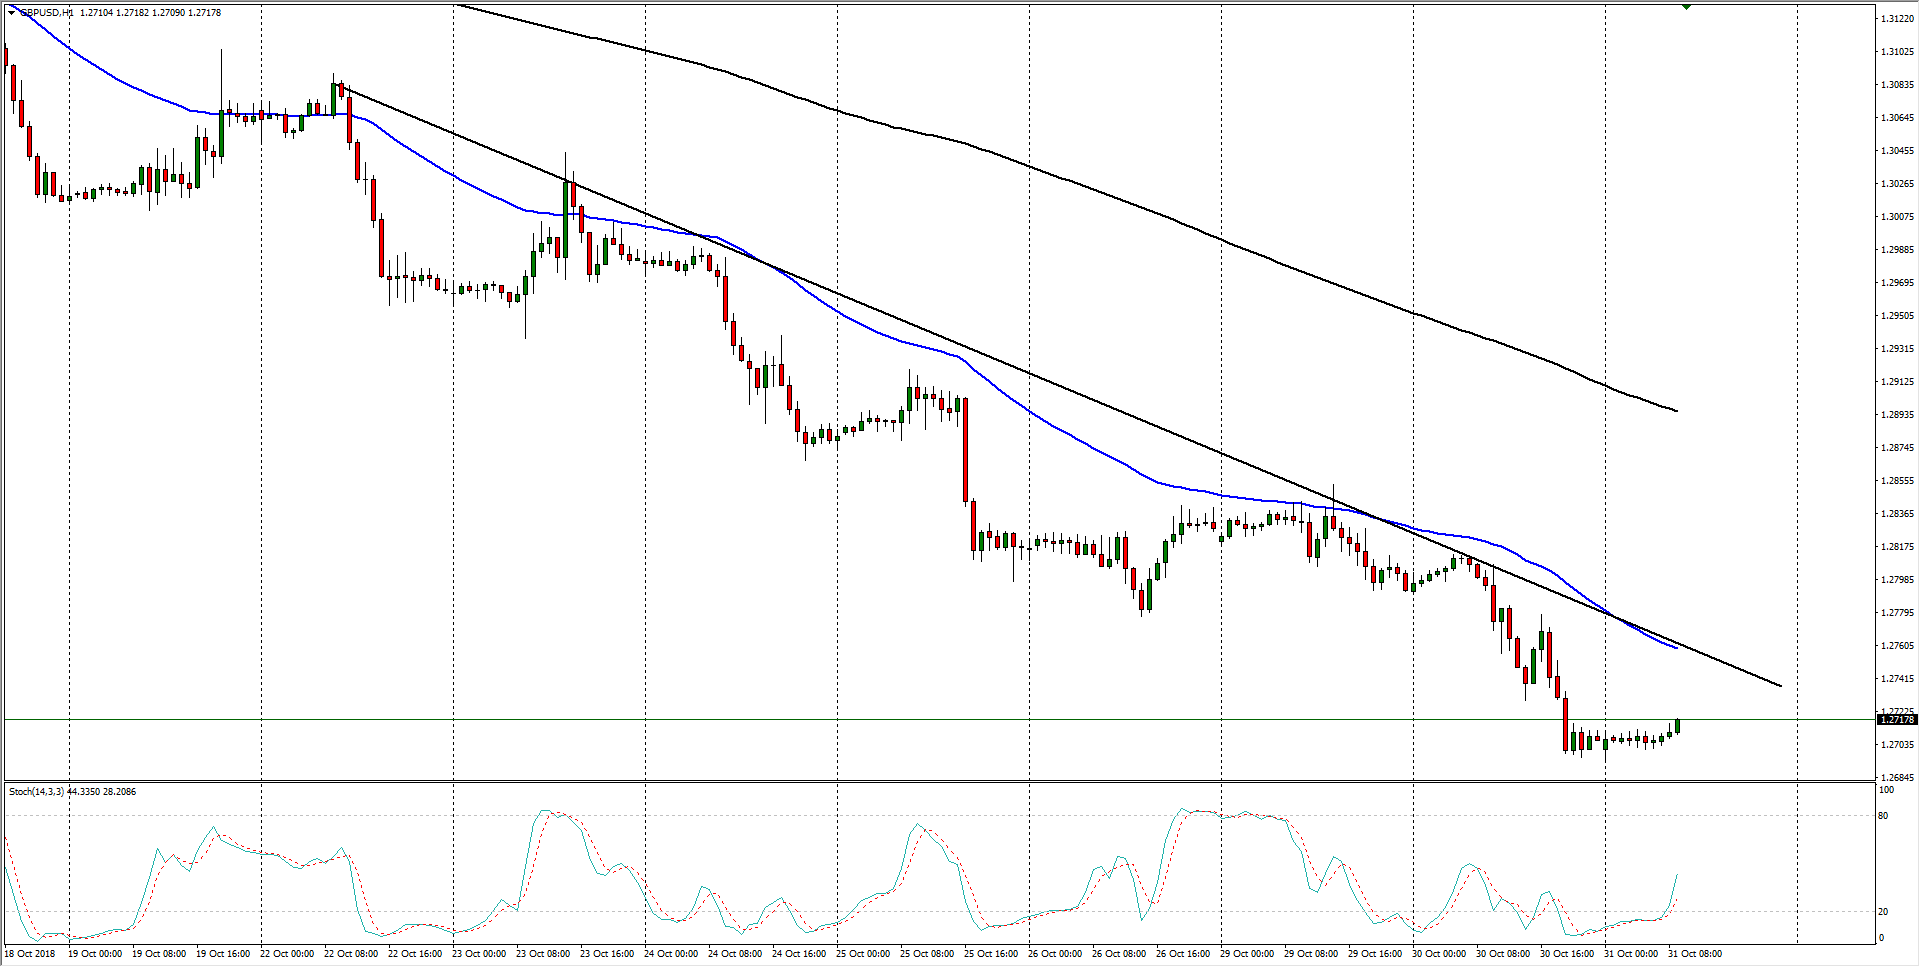
- On the H4 candles, the effects of Brexit fears is a clear picture of risk-off in the Cable, and the GBP/USD is trapped in a easy-to-ride bearish pattern.
GBP/USD, H4
Don't forget to check out FXStreet's own live chart to see instant GBP/USD updates!
GBP/USD
Overview:
Last Price: 1.2714
Daily change: 7.0 pips
Daily change: 0.0551%
Daily Open: 1.2707
Trends:
Daily SMA20: 1.302
Daily SMA50: 1.3018
Daily SMA100: 1.3054
Daily SMA200: 1.3447
Levels:
Daily High: 1.2814
Daily Low: 1.2696
Weekly High: 1.3092
Weekly Low: 1.2777
Monthly High: 1.33
Monthly Low: 1.2786
Daily Fibonacci 38.2%: 1.2741
Daily Fibonacci 61.8%: 1.2769
Daily Pivot Point S1: 1.2664
Daily Pivot Point S2: 1.2621
Daily Pivot Point S3: 1.2546
Daily Pivot Point R1: 1.2781
Daily Pivot Point R2: 1.2856
Daily Pivot Point R3: 1.2899
Author

Joshua Gibson
FXStreet
Joshua joins the FXStreet team as an Economics and Finance double major from Vancouver Island University with twelve years' experience as an independent trader focusing on technical analysis.


