|
GBP/USD technical analysis: Cable sinkink to 27-month lows approaching 1.2400 figure
- GBP/USD breaks to 27-month lows as the market is nearing 1.2400.
- Support is seen at 1.2385 and 1.2340 according to the Technical Confluences Indicator.

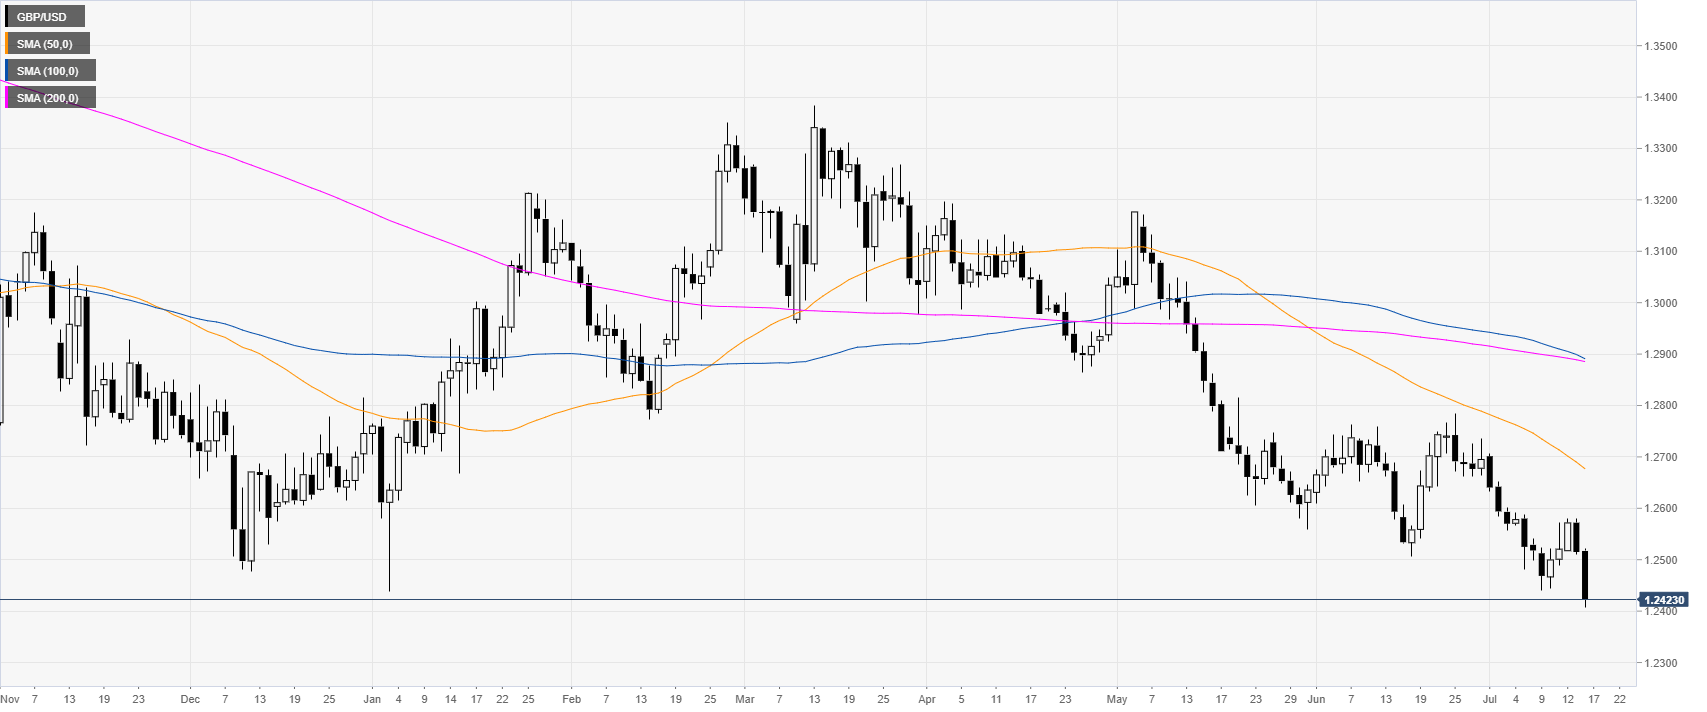
GBP/USD daily chart
GBP/USD is trading in a bear trend below its main daily simple moving averages (DSMAs). The market is approaching 1.2400 figure while trading at 27-month lows.
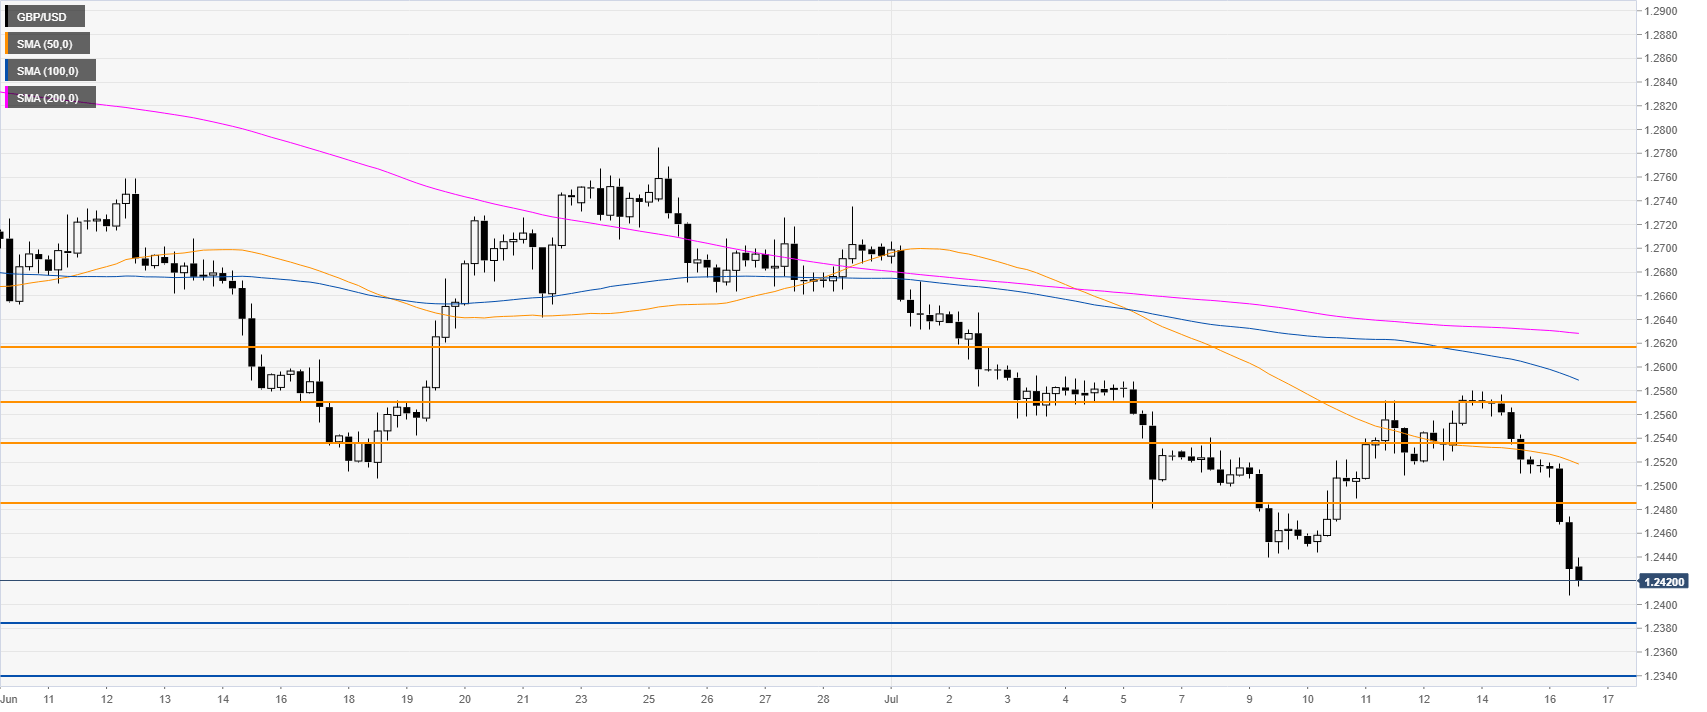
GBP/USD 4-hour chart
GBP/USD broke below 1.2485 support. Bears want to drive the market towards 1.2385 and 1.2340 level, according to the Technical Confluences Indicator. Cable is also trading below the main SMAs suggesting bearish momentum.
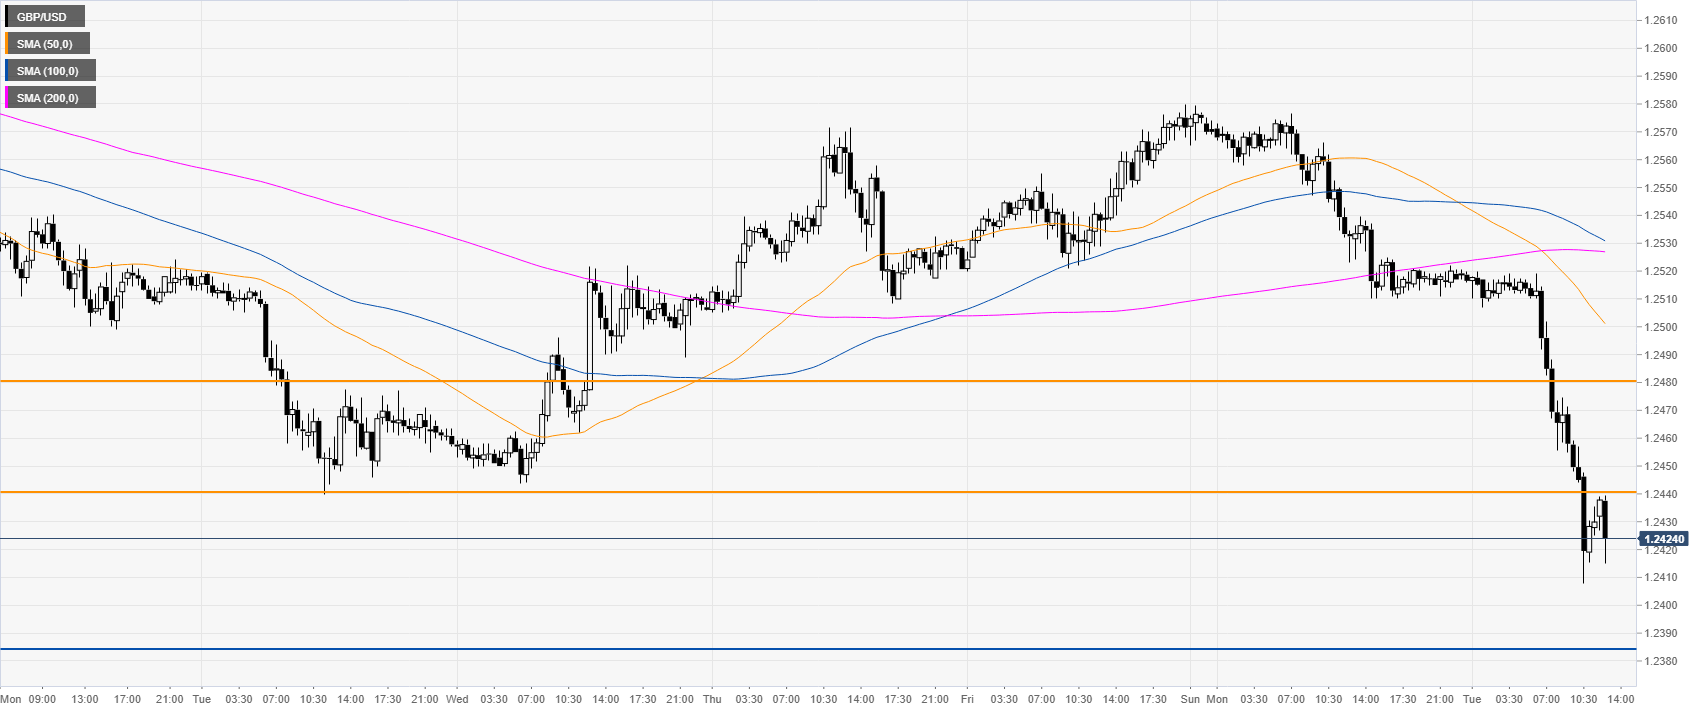
GBP/USD 30-minute chart
The market is under heavy bearish pressure. Immediate resistance can be seen at 1.2440 and 1.2480, according to the Technical Confluences Indicator.
Additional key levels
Author

Flavio Tosti
Independent Analyst
More from Flavio Tosti


