|
GBP/USD Technical Analysis: Cable hovering near 1.3000 figure
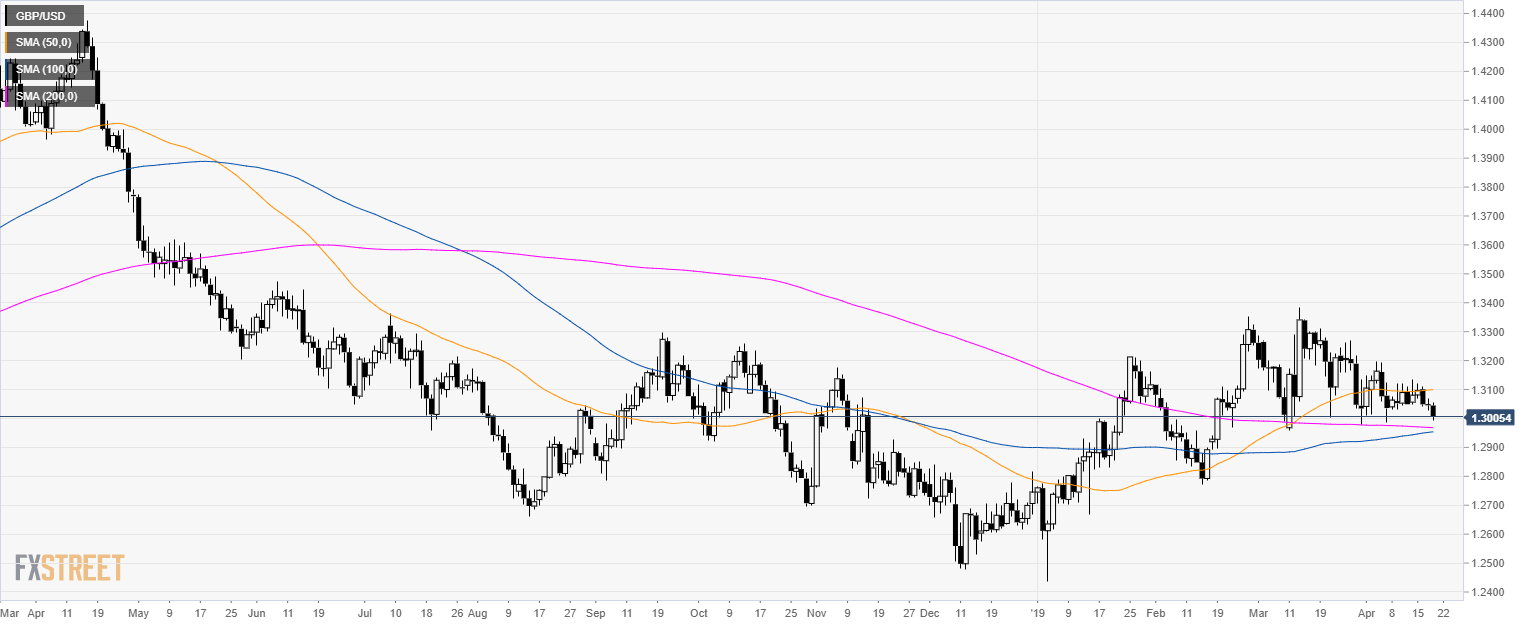
GBP/USD daily chart
- GBP/USD is trading in a bull trend above its 200-day simple moving avearge (SMA).
GBP/USD 4-hour chart
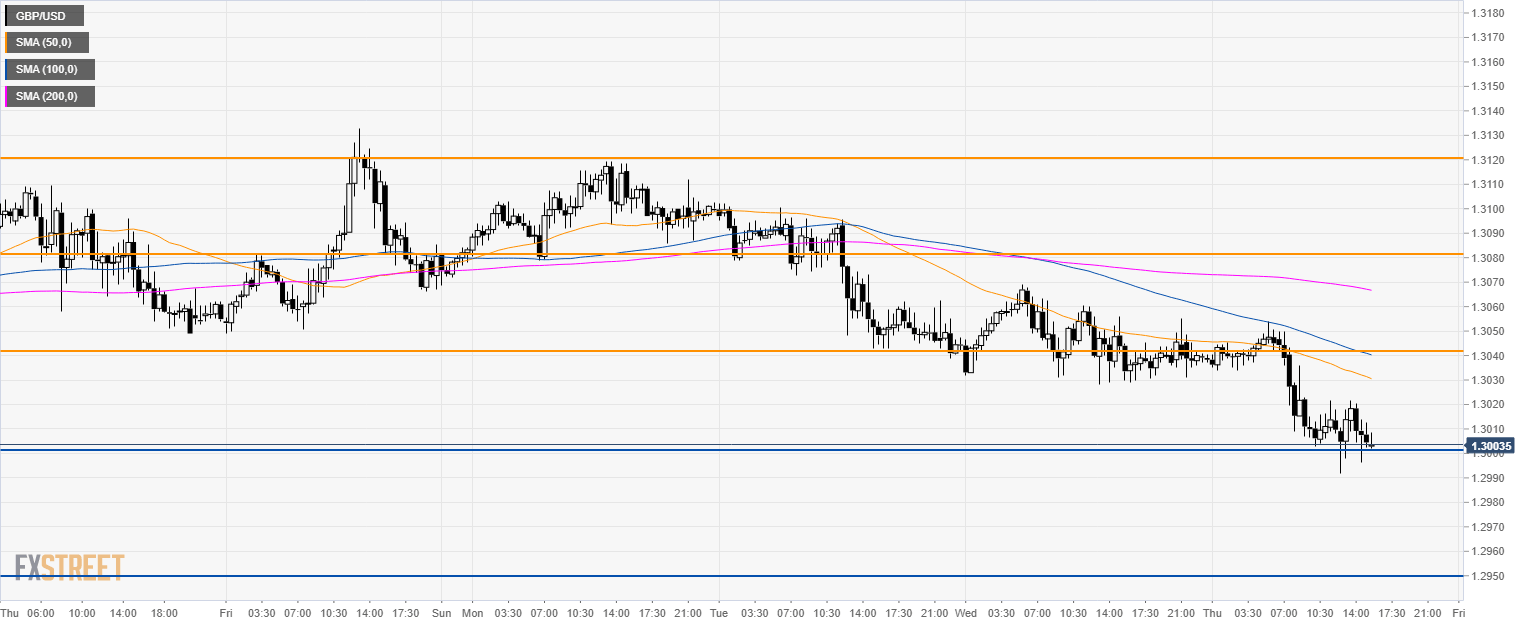
- GBP/USD is testing the 1.3000 figure.
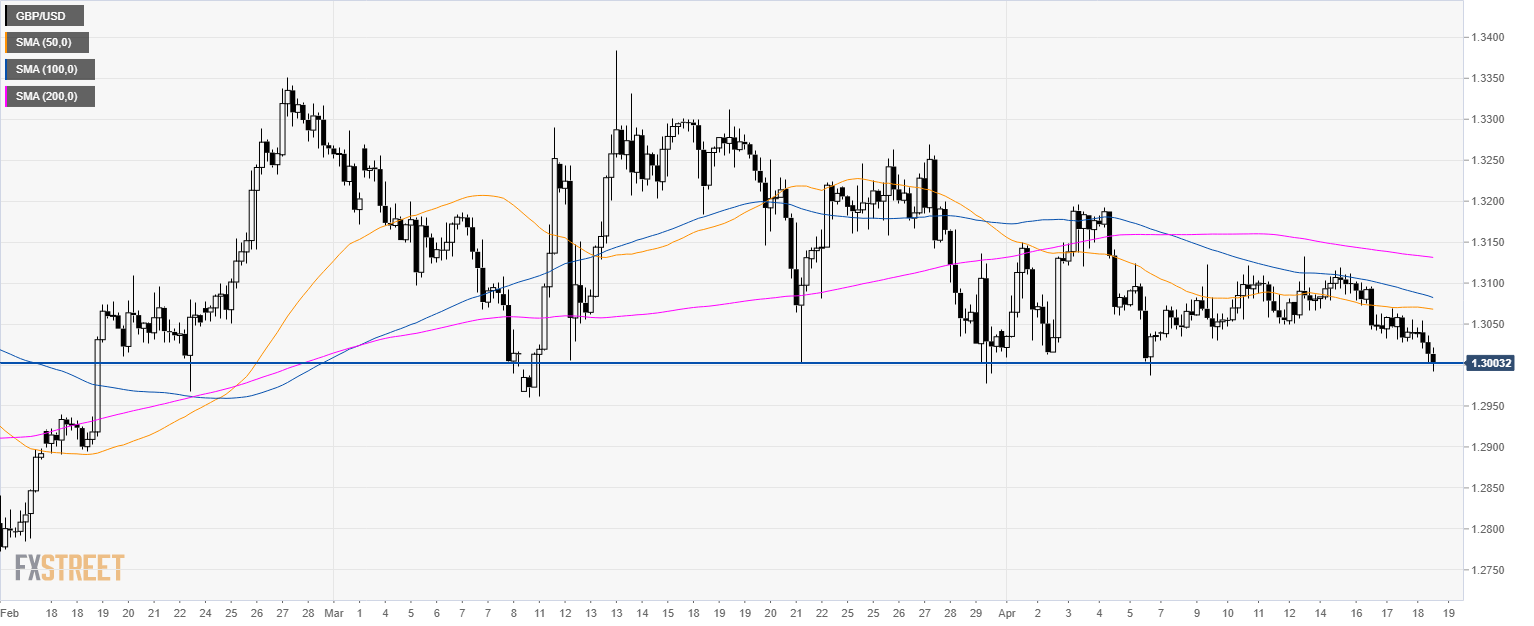
- The market is trading below its main SMAs suggesting a bearish bias in the short-term.
- 1.3000 is a key support and a breach of it would open the gates to 1.2950 level.
- Alternatively, a bounce can see 1.3040 revisited.
Additional key levels
Author

Flavio Tosti
Independent Analyst
More from Flavio Tosti


