|

GBP/USD technical analysis: Cable enters the New York session below the 1.2038 level as Brexit weighs

  • The Cable hits fresh multi-year lows this Tuesday. 
  • The levels to beat for sellers are seen at 1.2016, followed by 1.1957 support levels.
  • Buyers would need to have a daily close above 1.2132 to have a credible recovery.
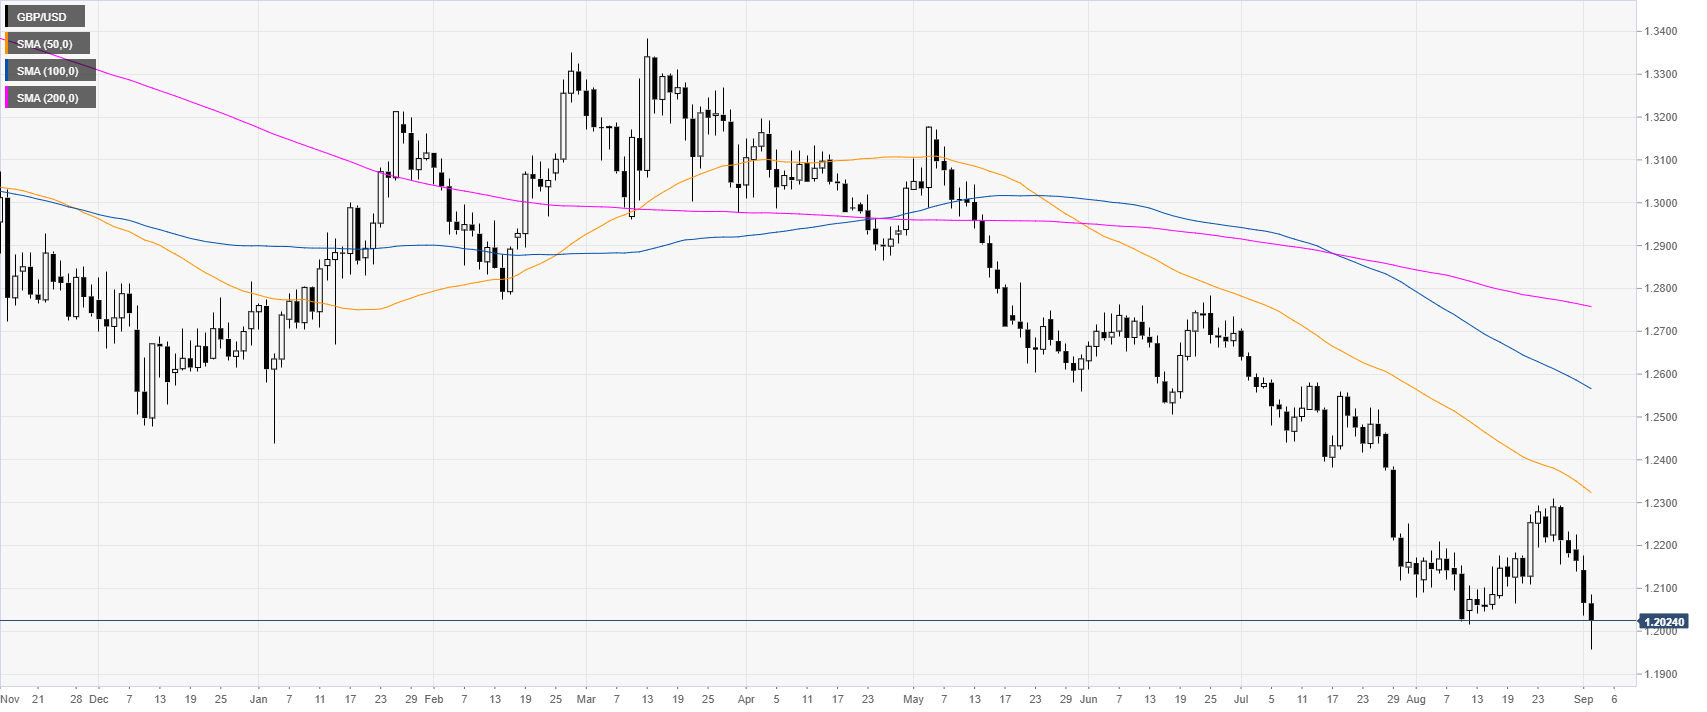
 

GBP/USD daily chart

 
The Sterling is trading in a bear trend below its main daily simple moving averages (SMAs) as it hit fresh multi-year lows. Brexit chaos is weighing heavily on the Pound.

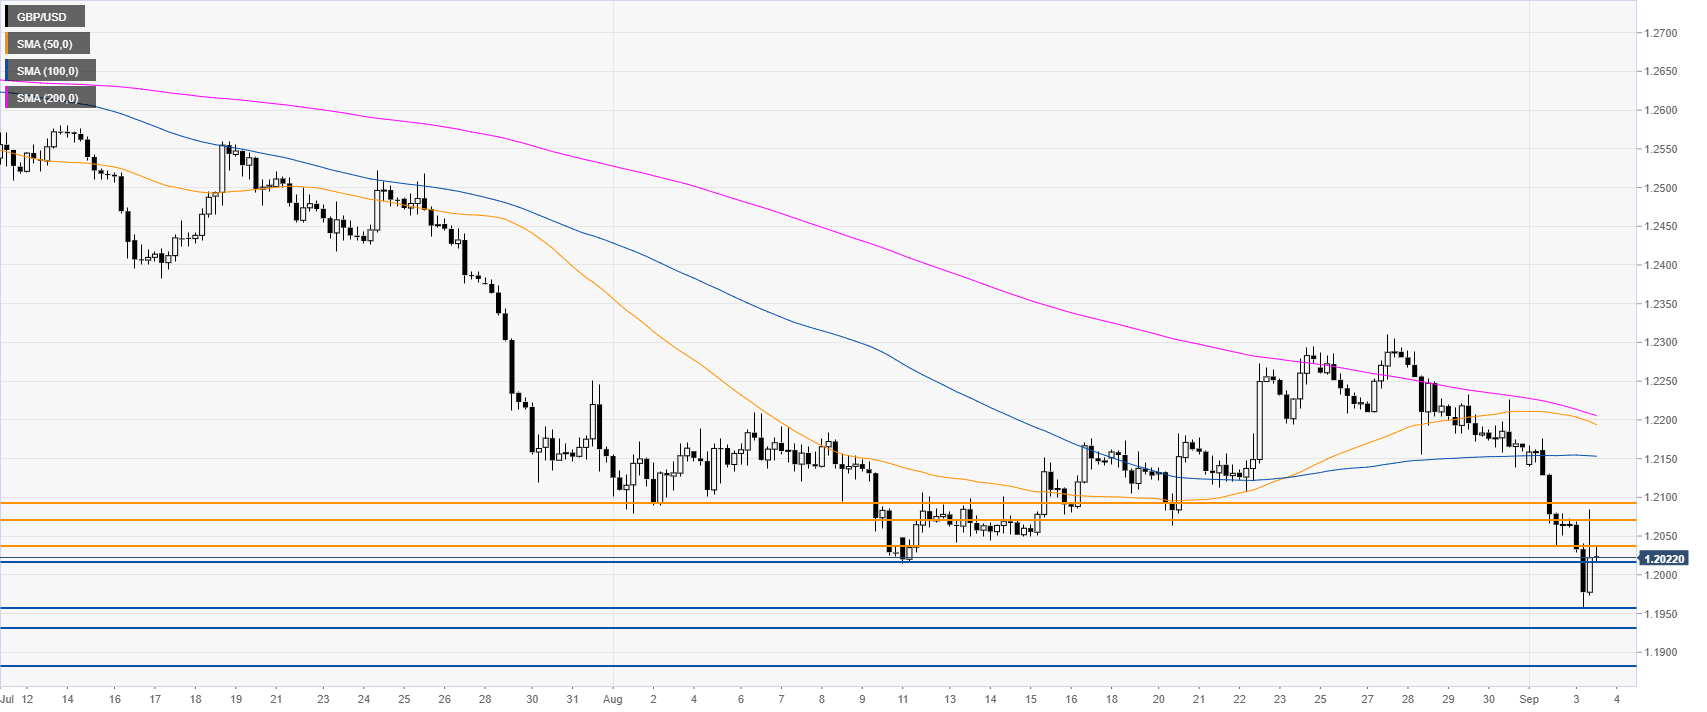
GBP/USD four-hour chart

 
The Cable is under bearish pressure below 1.2038 resistance and its main SMAs on the four-hour chart. The level to beat for sellers is 1.2016, followed by 1.1957, 1.1932 and 1.1880 level on the way down, according to the Technical Confluences Indicator.


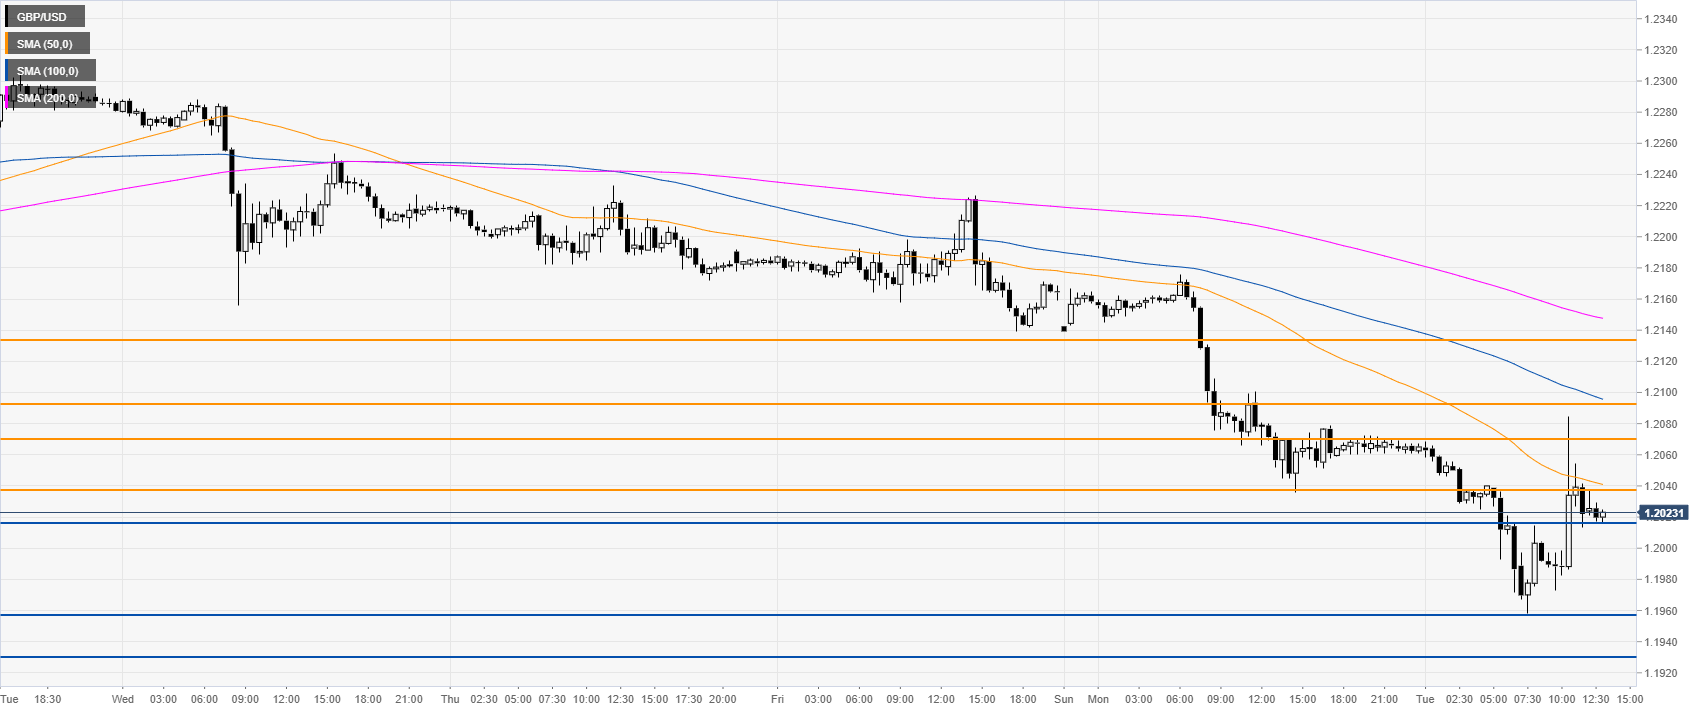
GBP/USD 30-minute chart

 
GBP/USD is trading below the main SMAs, suggesting a bearish bias in the near term. The market had a spike up above 1.2080 but the move up is fading. Immediate resistances are seen at 1.2038, 1.2070 and 1.2095, according to the Technical Confluences Indicator. Bulls would need to have a daily close above 1.2132 to have a credible recovery.
 

Additional key levels

GBP/USD

Overview
Today last price1.202
Today Daily Change-0.0046
Today Daily Change %-0.38
Today daily open1.2066
 
Trends
Daily SMA201.2149
Daily SMA501.2337
Daily SMA1001.2576
Daily SMA2001.2761
Levels
Previous Daily High1.2176
Previous Daily Low1.2036
Previous Weekly High1.231
Previous Weekly Low1.2139
Previous Monthly High1.231
Previous Monthly Low1.2015
Daily Fibonacci 38.2%1.2089
Daily Fibonacci 61.8%1.2122
Daily Pivot Point S11.201
Daily Pivot Point S21.1953
Daily Pivot Point S31.187
Daily Pivot Point R11.2149
Daily Pivot Point R21.2232
Daily Pivot Point R31.2288

Author

Flavio Tosti

Flavio Tosti

Independent Analyst


More from Flavio Tosti
Share:

Editor's Picks

EUR/USD struggles to regain momentum in the low1.1600s

EUR/USD is giving some signs of life in the aftermath of two severe days of losses on Wednesday, reclaiming the 1.1600 hurdle and above on the back of the resurgence of a mild selling bias around the US Dollar. Moving forward, the usual US weekly Claims will take centre stage on Thursday ahead of Friday’s crucial NFP data.
 

GBP/USD appears bid around 1.3370

GBP/USD reverses part of its recent multi-day decline, gathering some balance and managing to reach the 1.3400 region, where some initial resistance seems to have turned up. Cable’s uptick comes in response to some loss of momentum in the Greenback despite the geopolitical scenario remaining fragile.

Gold recovers modestly despite intensifying Middle East crisis

Gold keeps its daily gains well in place, although a break above the $5,200 mark per troy ounce still remains elusive on Wednesday. The yellow metal’s rebound comes in response to the persistent flight-to-safety amid intense geopolitical tensions in the Middle East and the bearish performance of the US Dollar.

XRP rises alongside peers as ETFs attract inflows

Ripple (XRP) is gaining upside momentum, trading above $1.40 at the time of writing on Wednesday. The remittance token is rising in tandem with major crypto assets, including Bitcoin (BTC), which has crossed above the pivotal $70,000 level, and Ethereum (ETH), which is holding above $2,000.

First Venezuela, now Iran: The US-China energy war escalates

At first glance, the latest escalation involving the United States with both Iran and Venezuela looks like another chapter in a long-running geopolitical story. But viewed through a broader strategic lens, something else may be unfolding: Energy.

Bittensor extends recovery despite retail demand slump

Bittensor, a leading Artificial Intelligence token, is aging up above $190 at the time of writing on Wednesday. Steady price increases characterise the broader crypto market, with Bitcoin holding above $71,000 and Ethereum above $2,000.