|

GBP/USD technical analysis: Cable bounces from daily lows and challenges the 1.2600 handle

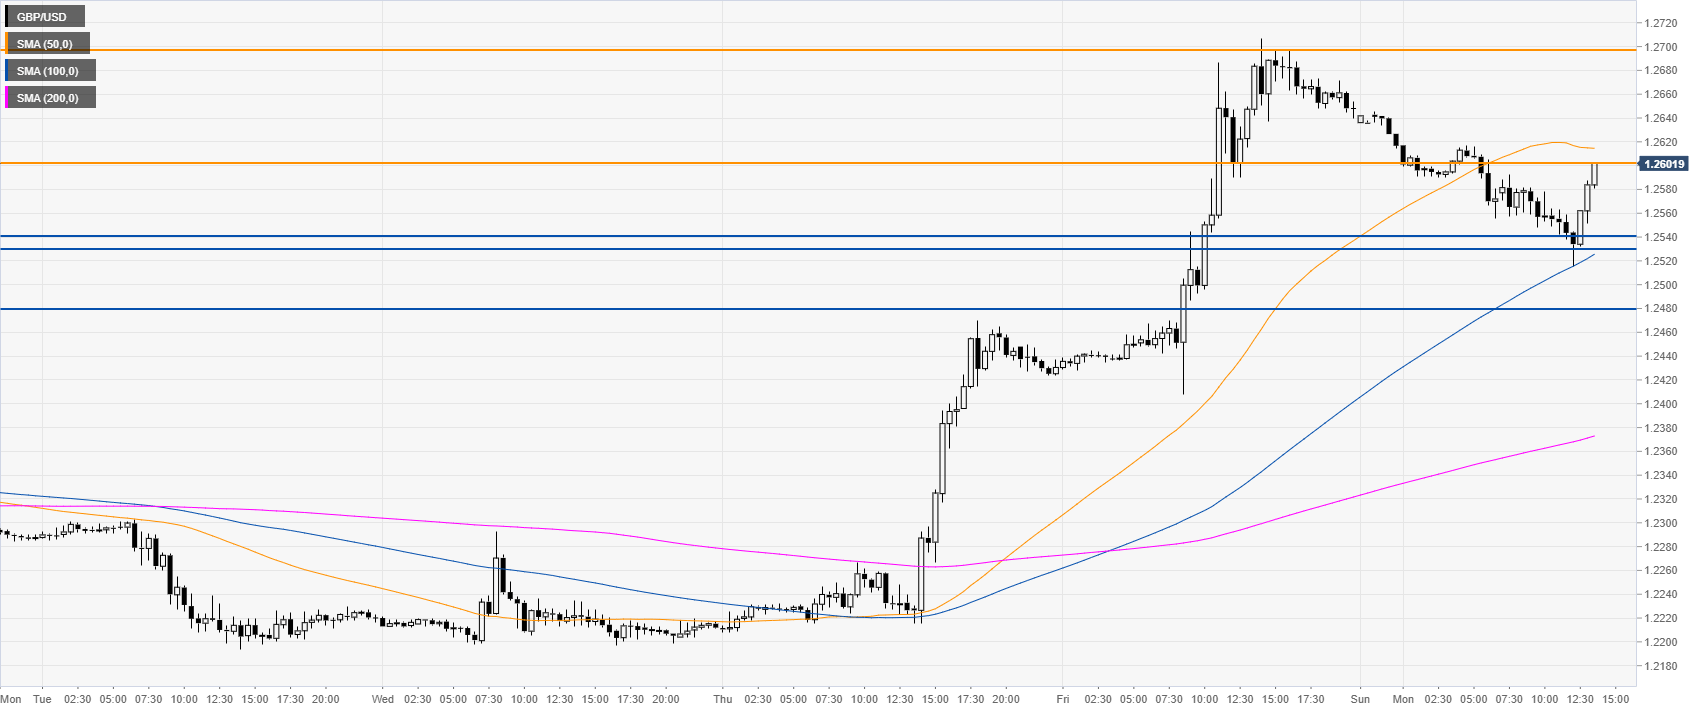
  • GBP/USD starts the week retracing part of the massive gains seen last weeks. 
  • GBP/USD is now battling with the 1.2600 handle in the last part of the London session.
 

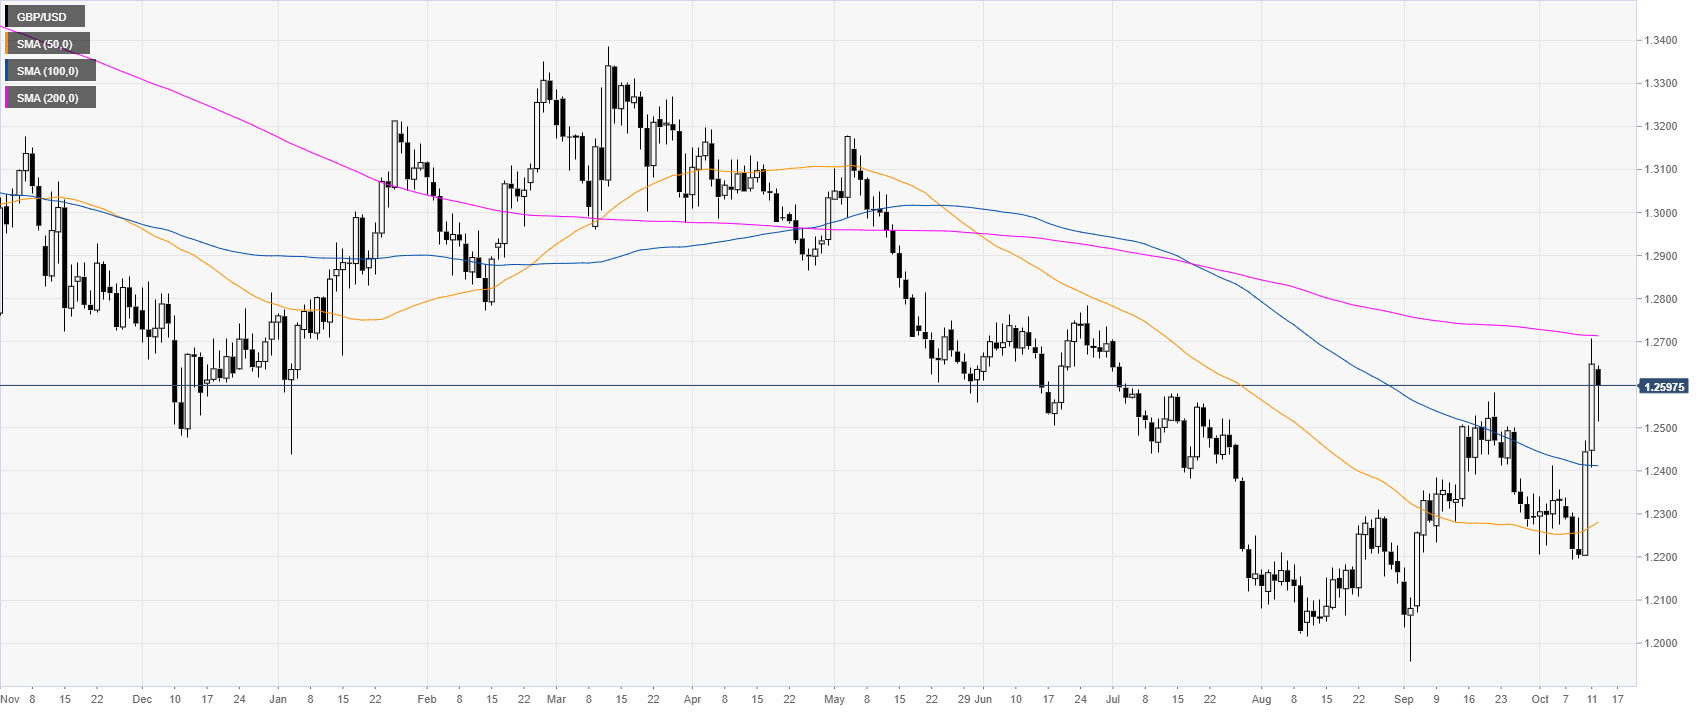
GBP/USD daily chart


The Cable, on the daily chart, is trading in a bear trend below its 200-day simple moving average (DSMA). This Monday, the market is consolidating last week's sudden spike related to Brexit deal optimism. 


GBP/USD four-hour chart

 
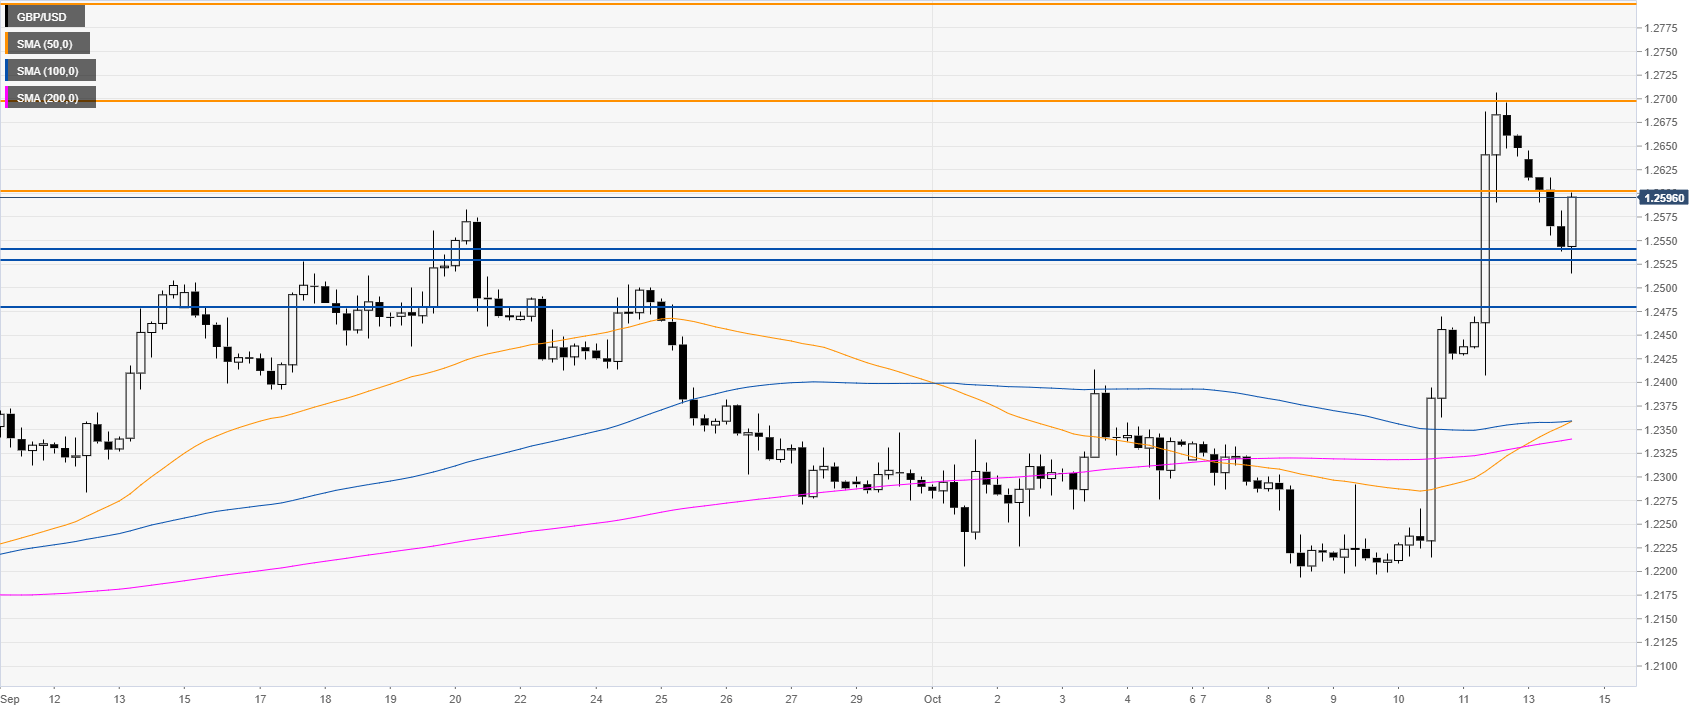
GBP/USD is challenging the 1.2600 handle in the last part of the London session. If the market breaks above this level, the next resistance of interest can be the 1.2700 handle, according to the Technical Confluences Indicator


GBP/USD 30-minute chart


The Sterling is trading above the 100 and SMAs, suggesting bullish momentum in the near term. Support is seen at the 1.2543/30 zone and the 1.2477 level, according to the Technical Confluences Indicator. 


Additional key levels

GBP/USD

Overview
Today last price1.2586
Today Daily Change-0.0062
Today Daily Change %-0.49
Today daily open1.2648
 
Trends
Daily SMA201.2382
Daily SMA501.2272
Daily SMA1001.2413
Daily SMA2001.2715
 
Levels
Previous Daily High1.2707
Previous Daily Low1.2408
Previous Weekly High1.2707
Previous Weekly Low1.2194
Previous Monthly High1.2583
Previous Monthly Low1.1958
Daily Fibonacci 38.2%1.2593
Daily Fibonacci 61.8%1.2522
Daily Pivot Point S11.2468
Daily Pivot Point S21.2288
Daily Pivot Point S31.2168
Daily Pivot Point R11.2768
Daily Pivot Point R21.2887
Daily Pivot Point R31.3067

Author

Flavio Tosti

Flavio Tosti

Independent Analyst


More from Flavio Tosti

Share:

Editor's Picks

GBP/USD trims losses, approaches 1.3500

GBP/USD adds to the multi-day negative streak, although it has managed to bounce off earlier four-week lows near 1.3470 on Wednesday. Meanwhile, Cable’s deep correction comes despite the tepid performance in the Greenback and the persistent geopolitical concerns.

EUR/USD slips back toward 1.1580 on USD recovery

EUR/USD comes under some pressure and revisits the 1.1580 region as the NA session draws to a close on Wednesday. That said, spot adds to Tuesday’s bearish performance while the Greenback is slowly gathering steam and leaving behind earlier lows.

Gold extends rebound above $4,400 as USD falls again

Gold extends the previous rebound above $4,400 in the Asian session on Thursday, moving further away from a four-week low of $4,283.Wednesday's weak US ADP report continues to counter escalating US-Iran tensions and September Fed rate hike bets, reviving the US Dollar downside and allowing the commodity to recover further ground.

Bitcoin holds $63K and $86K range as profit-taking risk builds

Bitcoin's recovery faces growing resistance as the market trades between a major accumulation zone below current prices and a dense concentration of potential supply overhead, according to a Glassnode report published Wednesday. After climbing above $80,000 on August 27, BTC encountered sustained selling pressure and retreated toward $76,000, triggering a series of long liquidations.

US President Donald Trump: Renewed campaign against Iran will not continue for too long
US President Donald Trump said that while the US is prepared to strike Iran again at any time, he doesn’t expect the renewed fighting to last “too long,” Reuters reported on Wednesday. Iran’s Supreme Leader Mojtaba Khamenei said that Iran’s armed forces have “unforgettable lessons” in store for the US in his first message since fighting resumed after a month of relative calm.
Diesel’s record $100 warning: The oil shock hiding in plain sight

The Oil market may look calmer than it did a few months ago, but diesel is sending a very different message. The US diesel crack spread, the premium of ultra-low sulphur diesel futures over WTI, recently surged above $100 per barrel for the first time, reaching an intraday record of just over $102.00.