|

GBP/USD Price Analysis: Struggles around 1.3900 despite triangle breakout

  • GBP/USD stalls the bounce as the US dollar resumes the upside.
  • Symmetrical triangle breakout on the 4H chart still keeps buyers hopeful.
  • RSI has turned south but holds above the midline.

GBP/USD is battling 1.3900 in early European dealing, as the US dollar picks up bids and resumes Tuesday’s uptrend.

Ongoing Brexit concerns over the Northern Ireland border issues and strong US economic data also weigh on the cable.

The focus shifts towards the NFP hints, in the form of the US ADP jobs and ISM Services PMI for near-term trading opportunities.

From a near term technical perspective, the cable is struggling to hold at higher levels despite a symmetrical triangle bullish breakout confirmed on the four-hour chart earlier today,

The bulls need to take out the daily highs at 1.3915 on a sustained basis, in order the 1.3950 level in their stride.

The Relative Strength Index (RSI) has turned south but remains well above the midline, backing the recent pause in the bounce.   

GBP/USD four-hourly chart

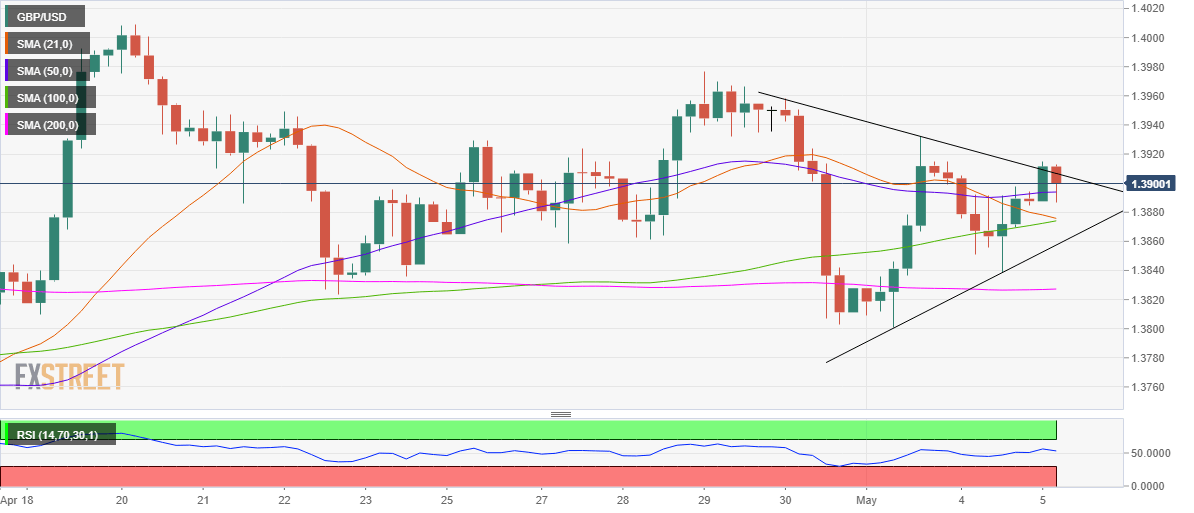
A four-hourly closing below the 50-simple moving average (SMA) at 1.3893 could revive the selling momentum.

The downside could be then exposed towards 1.3874, the intersection of the 21 and 100-SMAs.

Further south, Tuesday’s low of 1.3839 could be put to test.

GBP/USD additional levels to watch

GBP/USD

Overview
Today last price1.3900
Today Daily Change0.0019
Today Daily Change %0.14
Today daily open1.3889
 
Trends
Daily SMA201.3847
Daily SMA501.3864
Daily SMA1001.3772
Daily SMA2001.3437
 
Levels
Previous Daily High1.3915
Previous Daily Low1.3838
Previous Weekly High1.3976
Previous Weekly Low1.3803
Previous Monthly High1.4009
Previous Monthly Low1.3669
Daily Fibonacci 38.2%1.3868
Daily Fibonacci 61.8%1.3886
Daily Pivot Point S11.3846
Daily Pivot Point S21.3804
Daily Pivot Point S31.377
Daily Pivot Point R11.3923
Daily Pivot Point R21.3957
Daily Pivot Point R31.3999

Author

Dhwani Mehta

Dhwani Mehta

FXStreet

Residing in Mumbai (India), Dhwani is a Senior Analyst and Manager of the Asian session at FXStreet. She has over 10 years of experience in analyzing and covering the global financial markets, with specialization in Forex and commodities markets.

More from Dhwani Mehta
Share:

Editor's Picks

AUD/USD eyes 0.7150 barrier nine-day EMA

AUD/USD inches higher after registering modest losses in the previous day, trading around 0.7130 during the Asian hours. The technical analysis of the daily chart indicates that the pair is moving sideways within the rectangle pattern, suggesting a consolidation as neither the bulls nor the bears have enough momentum to take control of the market.

USD/JPY trades below 160.00 intervention threshold; bullish bias intact

The USD/JPY pair attracts some sellers during the Asian session amid fears that authorities will step in again to prop up the Japanese Yen. Furthermore, the Israel-Lebanon truce prompts some profit-taking around the US Dollar and exerts downward pressure on the currency pair.

Gold extends rebound to $4,500 as US yields edge lower

Gold (XAU/USD) preserves its recovery momentum following Wednesday's slide and tests the $4,500 mark in the second half of the day on Thursday. While US-Iran uncertainty remains, easing tensions between Lebanon on Israel seems to be helping the market mood improve, causing the USD to lose strength alongside falling US T-bond yields and opening the door for a decisive rebound in XAU/USD.

Bitcoin’s massive storm is back: Why the sell-off is far from over

Bitcoin price action over the last few weeks has felt less like a normal, healthy correction and more like a slow grinding crash that continues to wreak havoc on holdings and trading accounts. And everything suggests that the dramatic crash isn’t over.

Nonfarm payrolls: Testing the limits of Fed policy patience

The upcoming nonfarm payrolls report for May will provide the final update on the US labor market before Kevin Warsh attends his first policy meeting as the new Fed Chair later this month.

Recession on paper: What really moves the Canadian Loonie now?

Statistics Canada handed the headline writers a gift and the analysts a headache. Real GDP shrank 0.1% on an annualized basis in the first quarter, and with the fourth quarter of 2025 revised down to a 1.0% contraction, that is two negative quarters in a row, the textbook definition of a technical recession and Canada's first since the pandemic.