GBP/USD Price Analysis: Rebound from 1.3800 prints bullish flag
- GBP/USD holds onto the recovery moves inside a bullish chart pattern.
- Firmer RSI, sustained trading beyond 200-SMA favor buyers.
- 1.3910 becomes a tough nut to crack for the bulls, bears may aim for late July tops.
GBP/USD bulls take a breather around 1.3870-65, after snapping a three-day uptrend, amid Thursday’s Asian session.
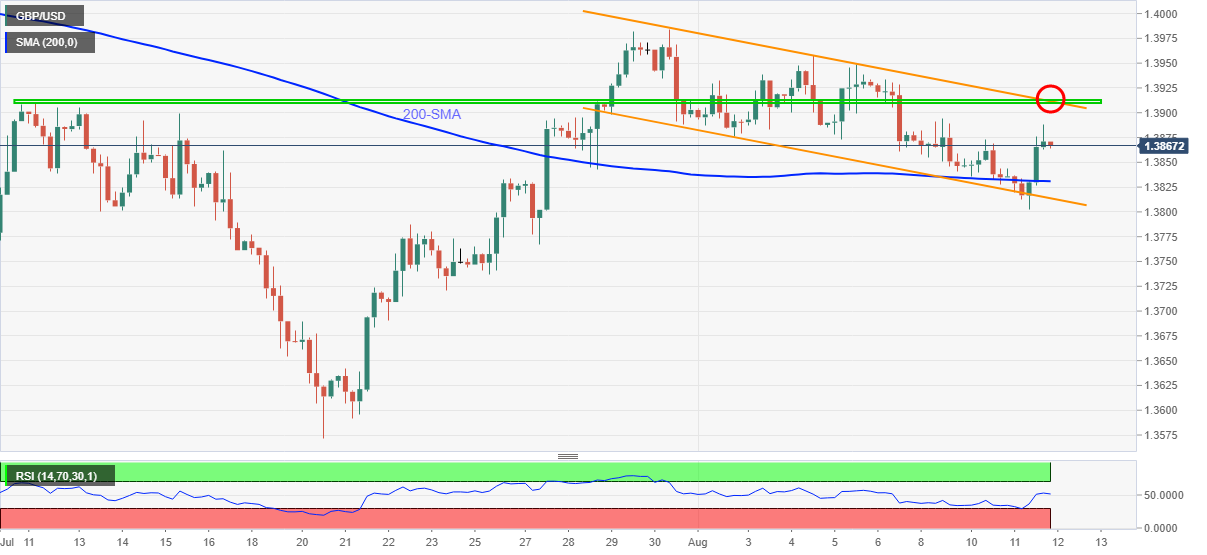
The cable pair dropped to the lowest in 12 days before bouncing off 1.3802 the previous day. In doing so, the quote portrays a bullish flag formation on the four-hour (4H) play.
In addition to the upside favoring chart pattern, the pair’s sustained trading above 200-SMA and steady RSI, modest as well, keep GBP/USD buyers hopeful.
However, a convergence of the flag’s upper line and early July’s top, surrounding 1.3910, becomes a strong resistance for the bulls to cross before aiming the previous month’s high near 1.3985 and the 1.4000 threshold.
Meanwhile, 200-SMA around 1.3830 will initially challenge the pullback moves before the support line of the flag, near 1.3810, stops the GBP/USD sellers.
Even if the pair drops below 1.3810, the 1.3800 round figure and July 22 peak close to the 1.3785, will test the bears.
GBP/USD: Four-hour chart
Trend: Further recovery expected
Author

Anil Panchal
FXStreet
Anil Panchal has nearly 15 years of experience in tracking financial markets. With a keen interest in macroeconomics, Anil aptly tracks global news/updates and stays well-informed about the global financial moves and their implications.


