GBP/USD Price Analysis: Rally stalls after touching 200-week SMA
- GBP/USD has pulled back after touching resistance from the 200-week SMA.
- The pair could be forming an ABC move on the daily chart with a target in the 1.3000s.
- The 4-hour chart is looking a little vulnerable but remains supported for now.
GBP/USD has been rallying higher but it has stalled at the start of the new week after touching resistance at the 200-week Simple Moving Average (SMA). So far, the pullback looks like a correction in an evolving uptrend.
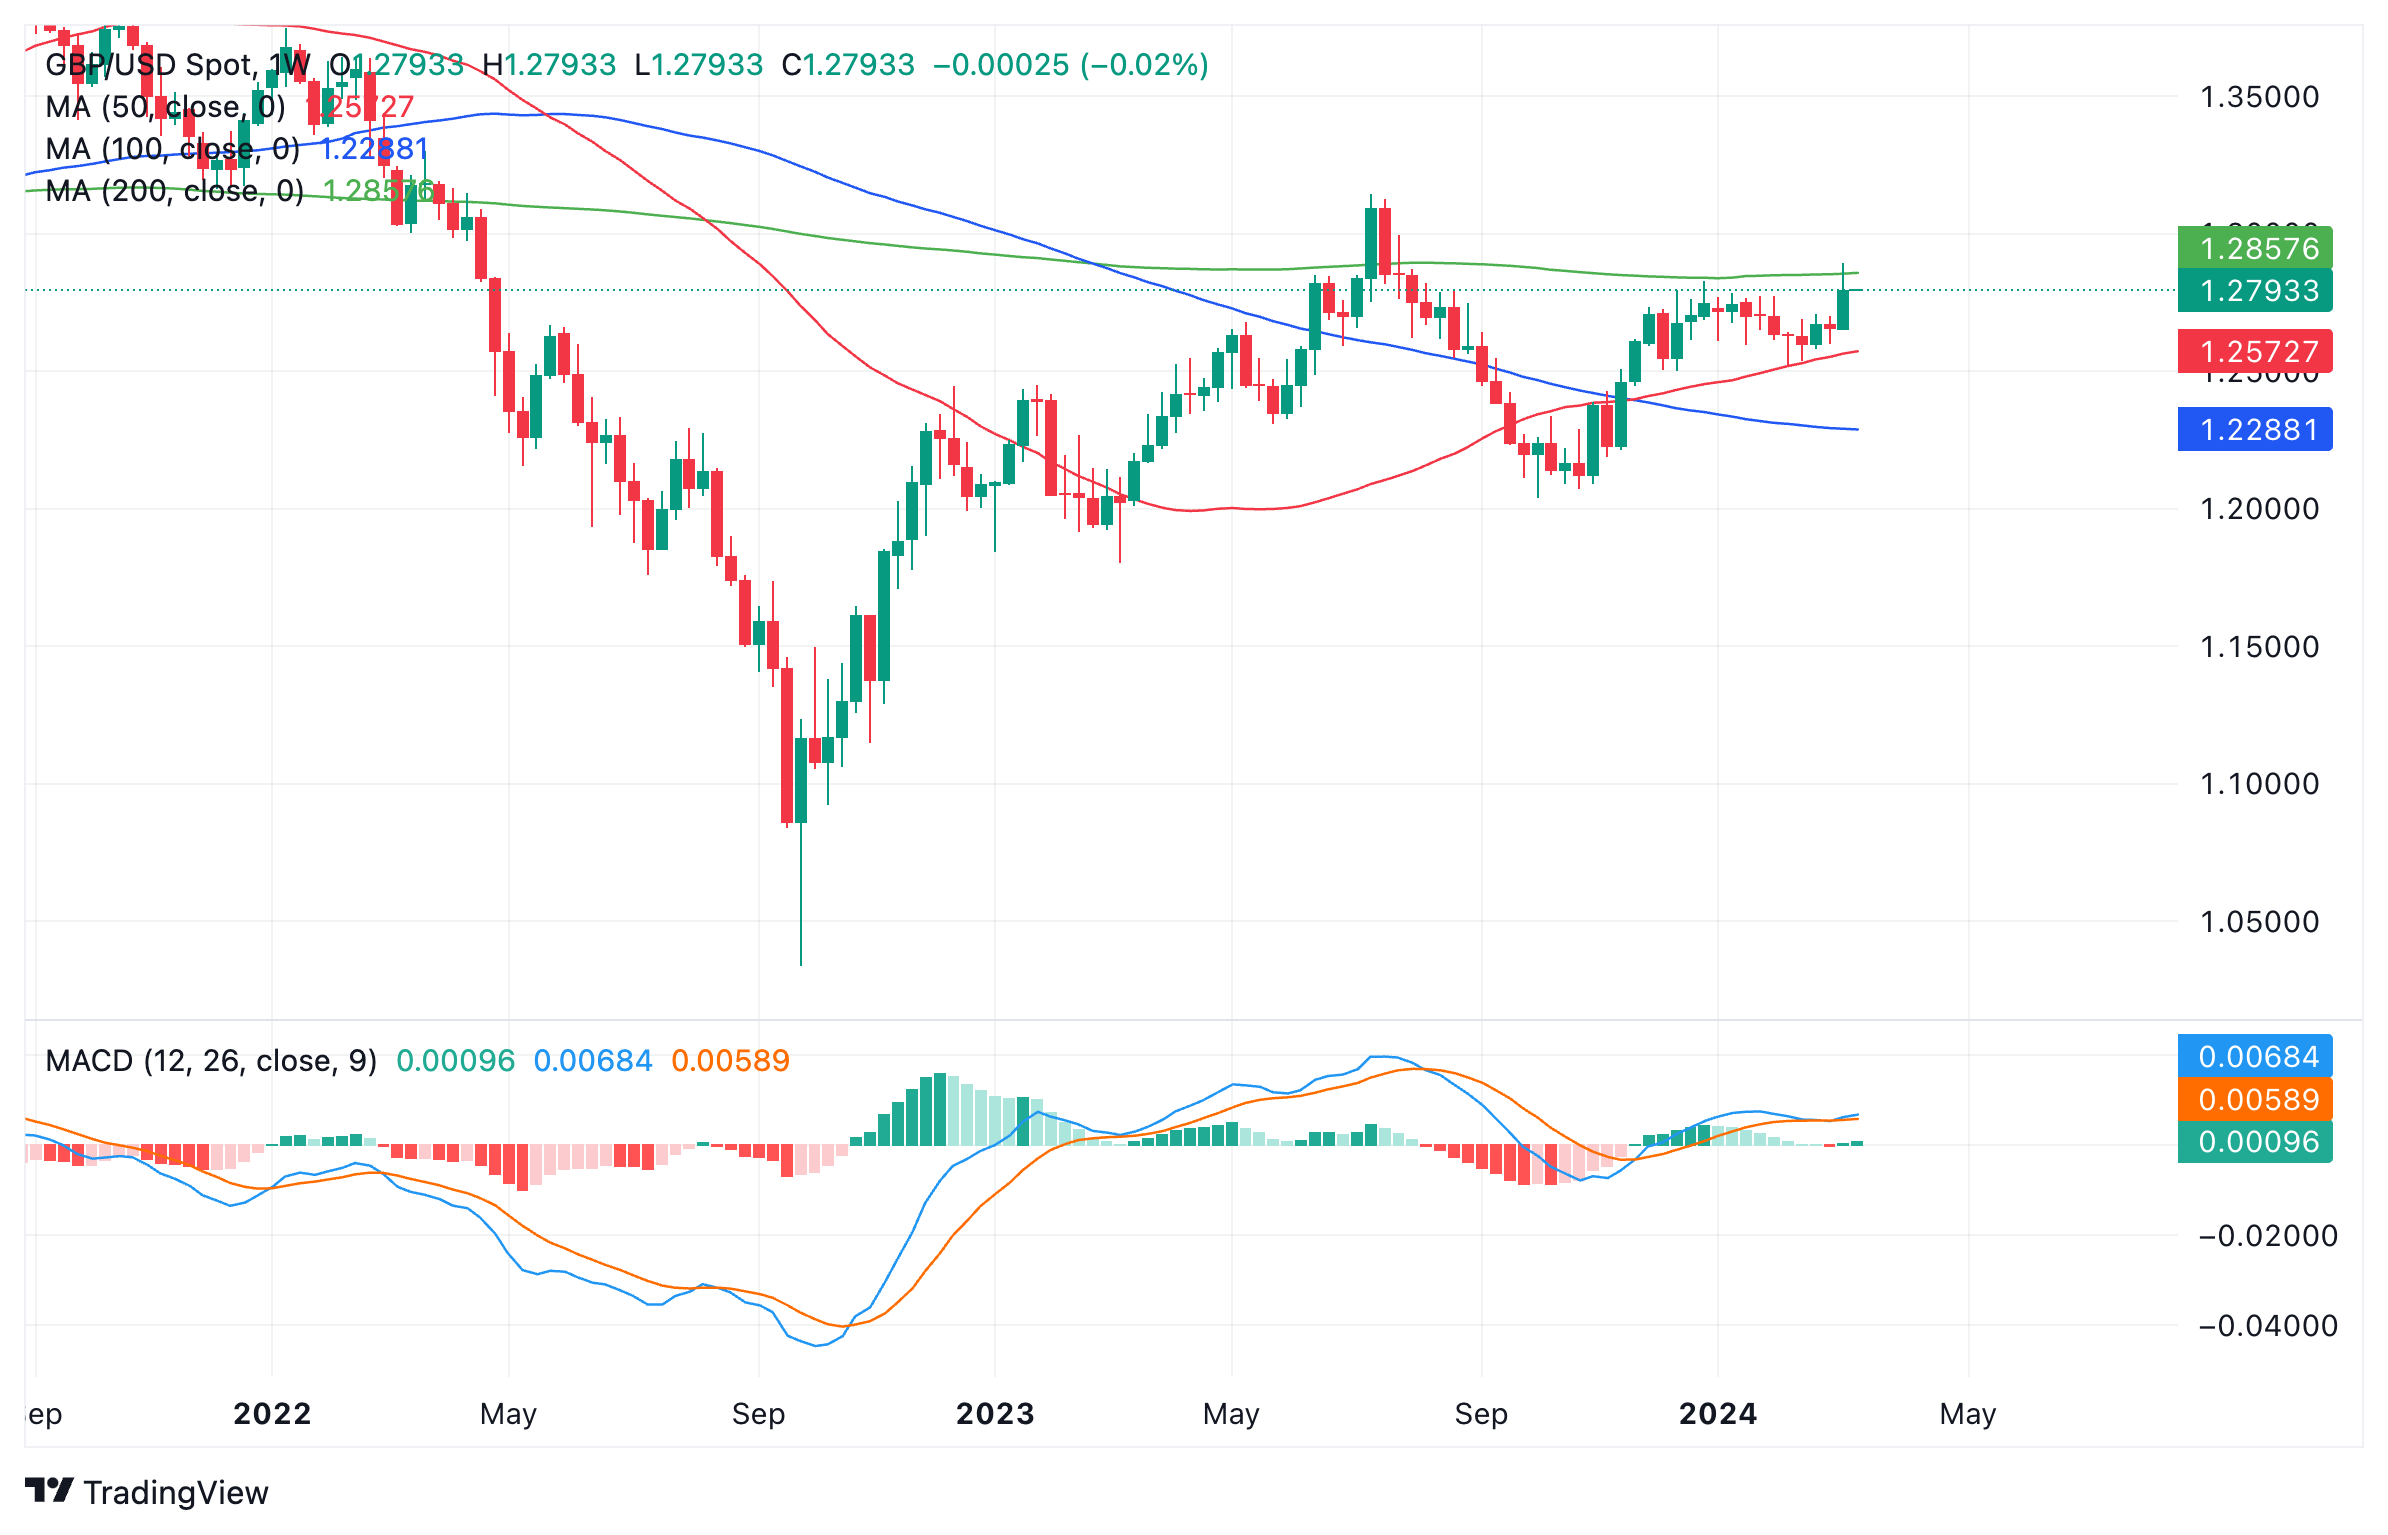
Pound Sterling vs US Dollar: Weekly chart
The pair has probably formed a bullish three-wave ABC Measured Move. If so, we are currently in the middle of the C wave, which should end somewhere between 1.3045 – 61.8% Fibonacci extension of wave A – and 1.3340, which is where C is 100% of A. The July highs in the 1.3130s is another target for the end of C.
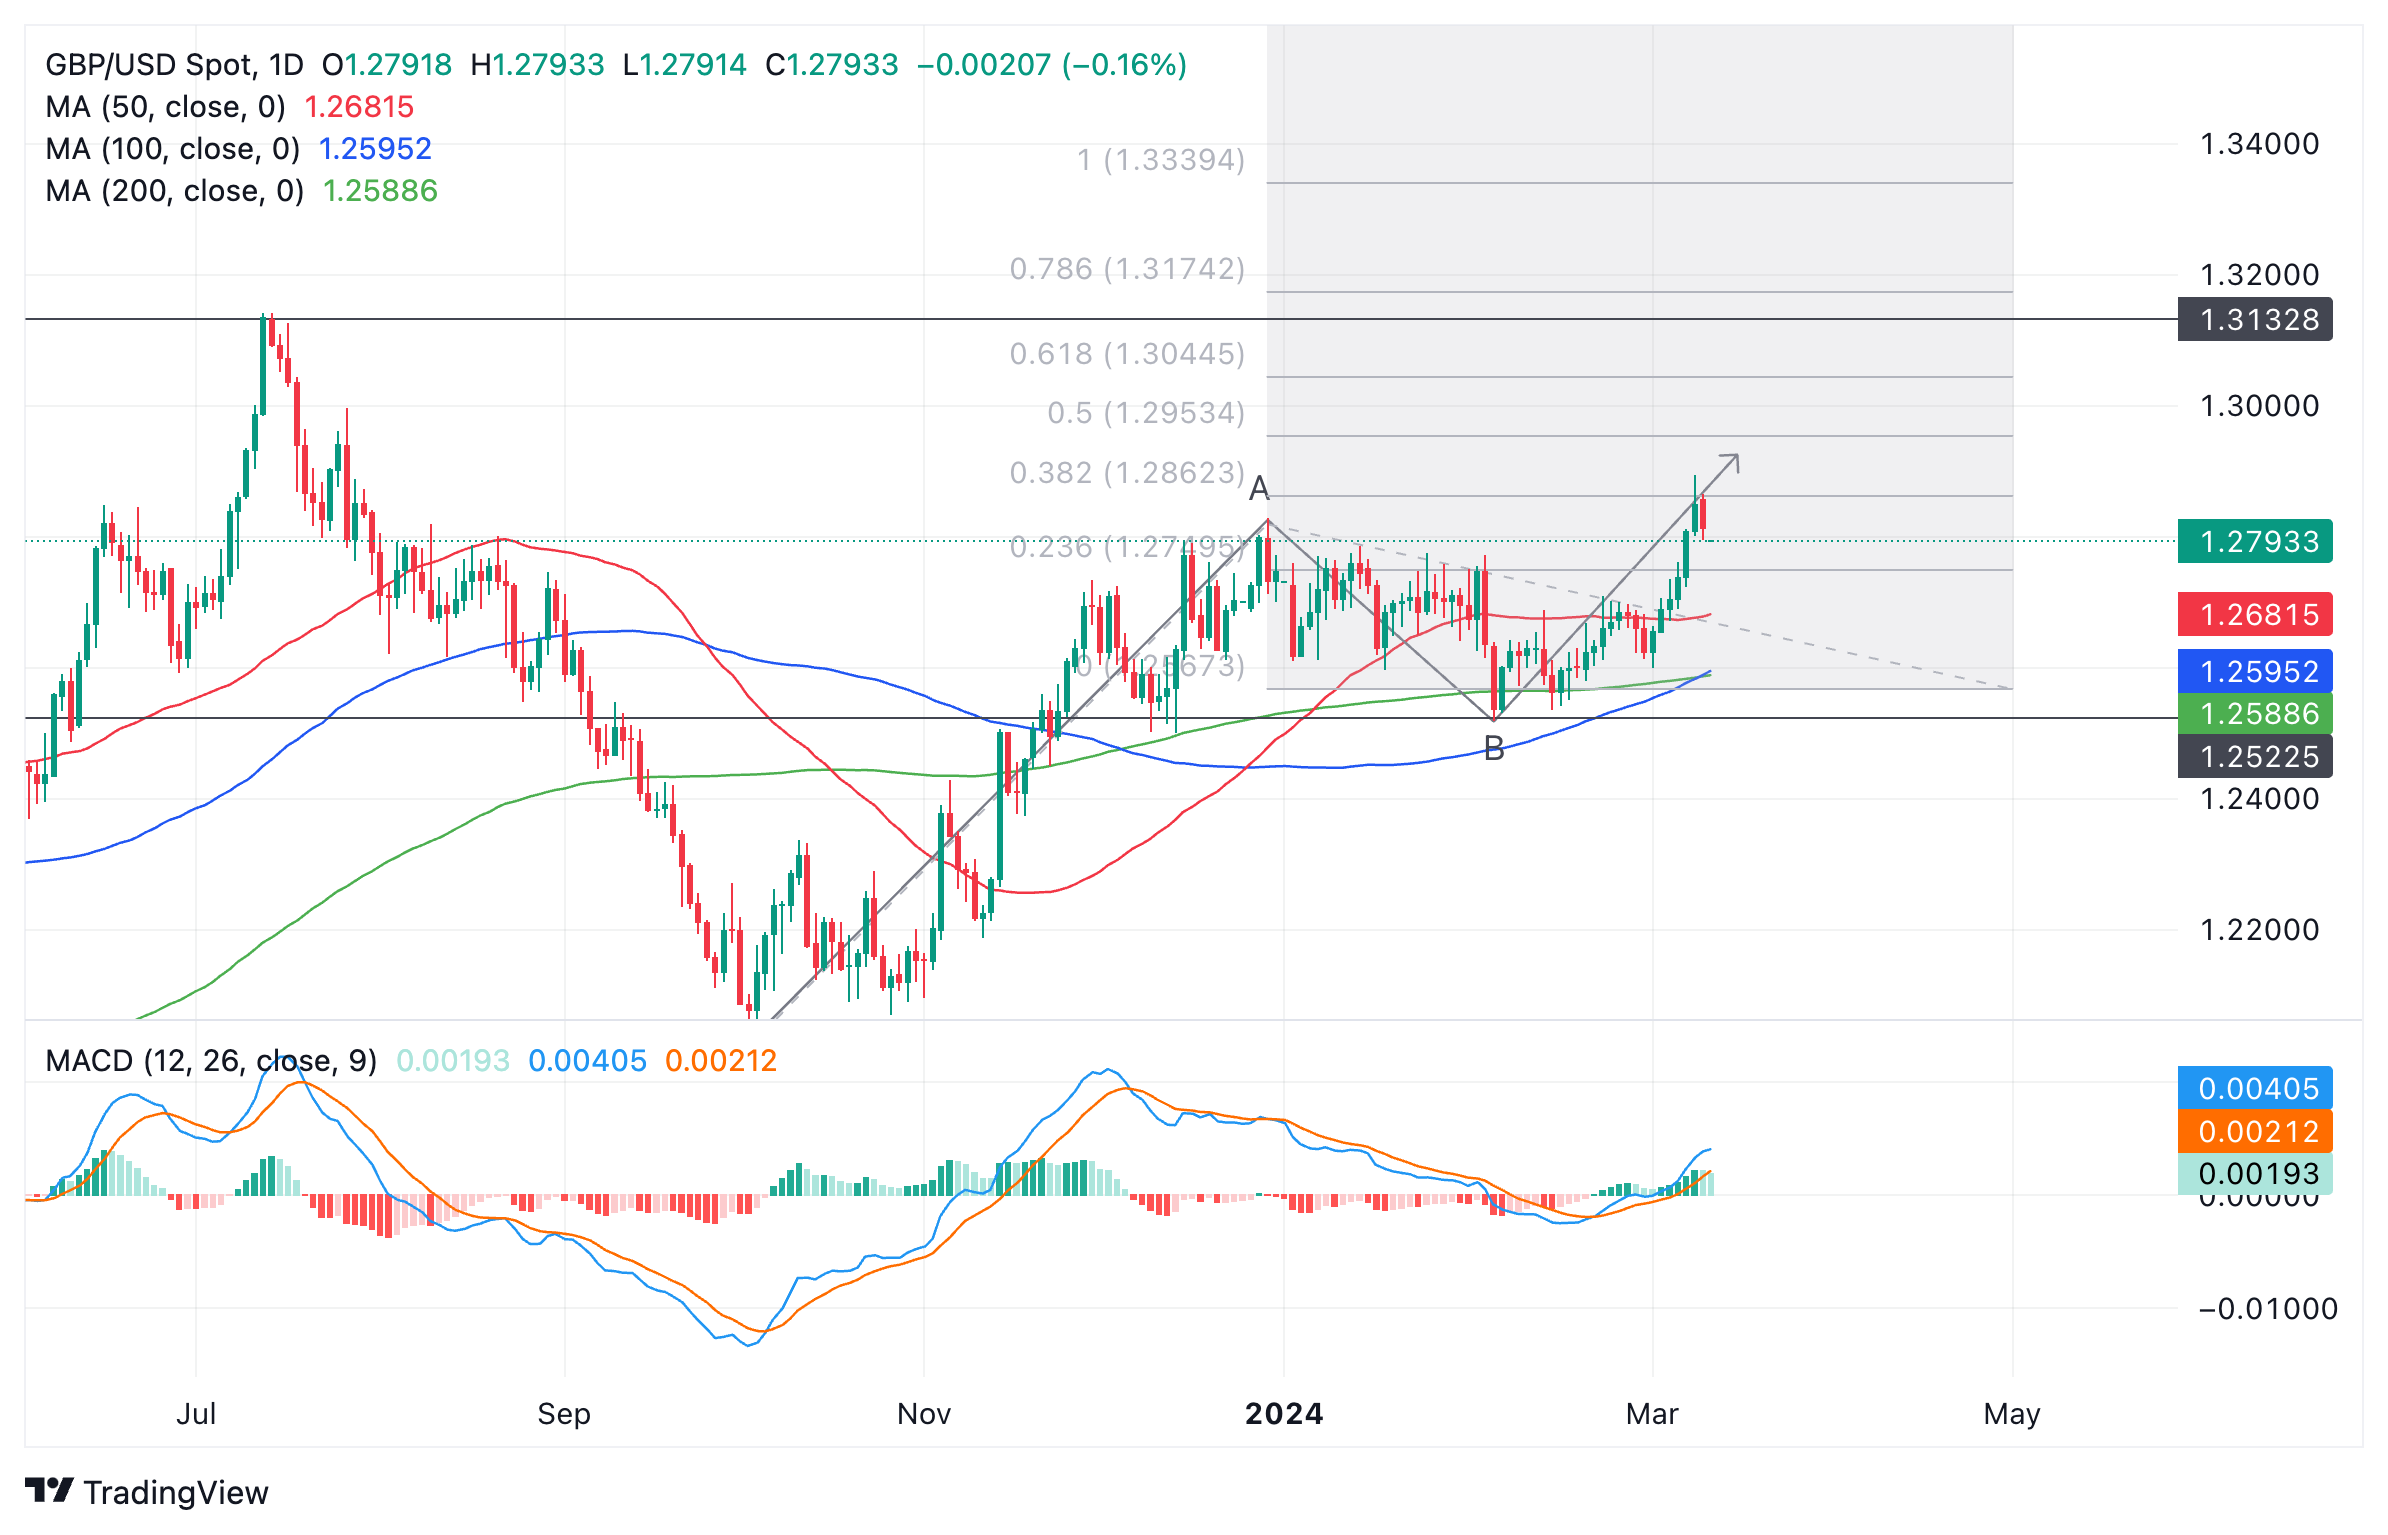
Pound Sterling vs US Dollar: Daily chart
A strong, decisive move back above the 1.2890 highs could provide the confirmation of an extension of C to its target.
The 4-hour chart below shows a less bullish short-term technical picture.
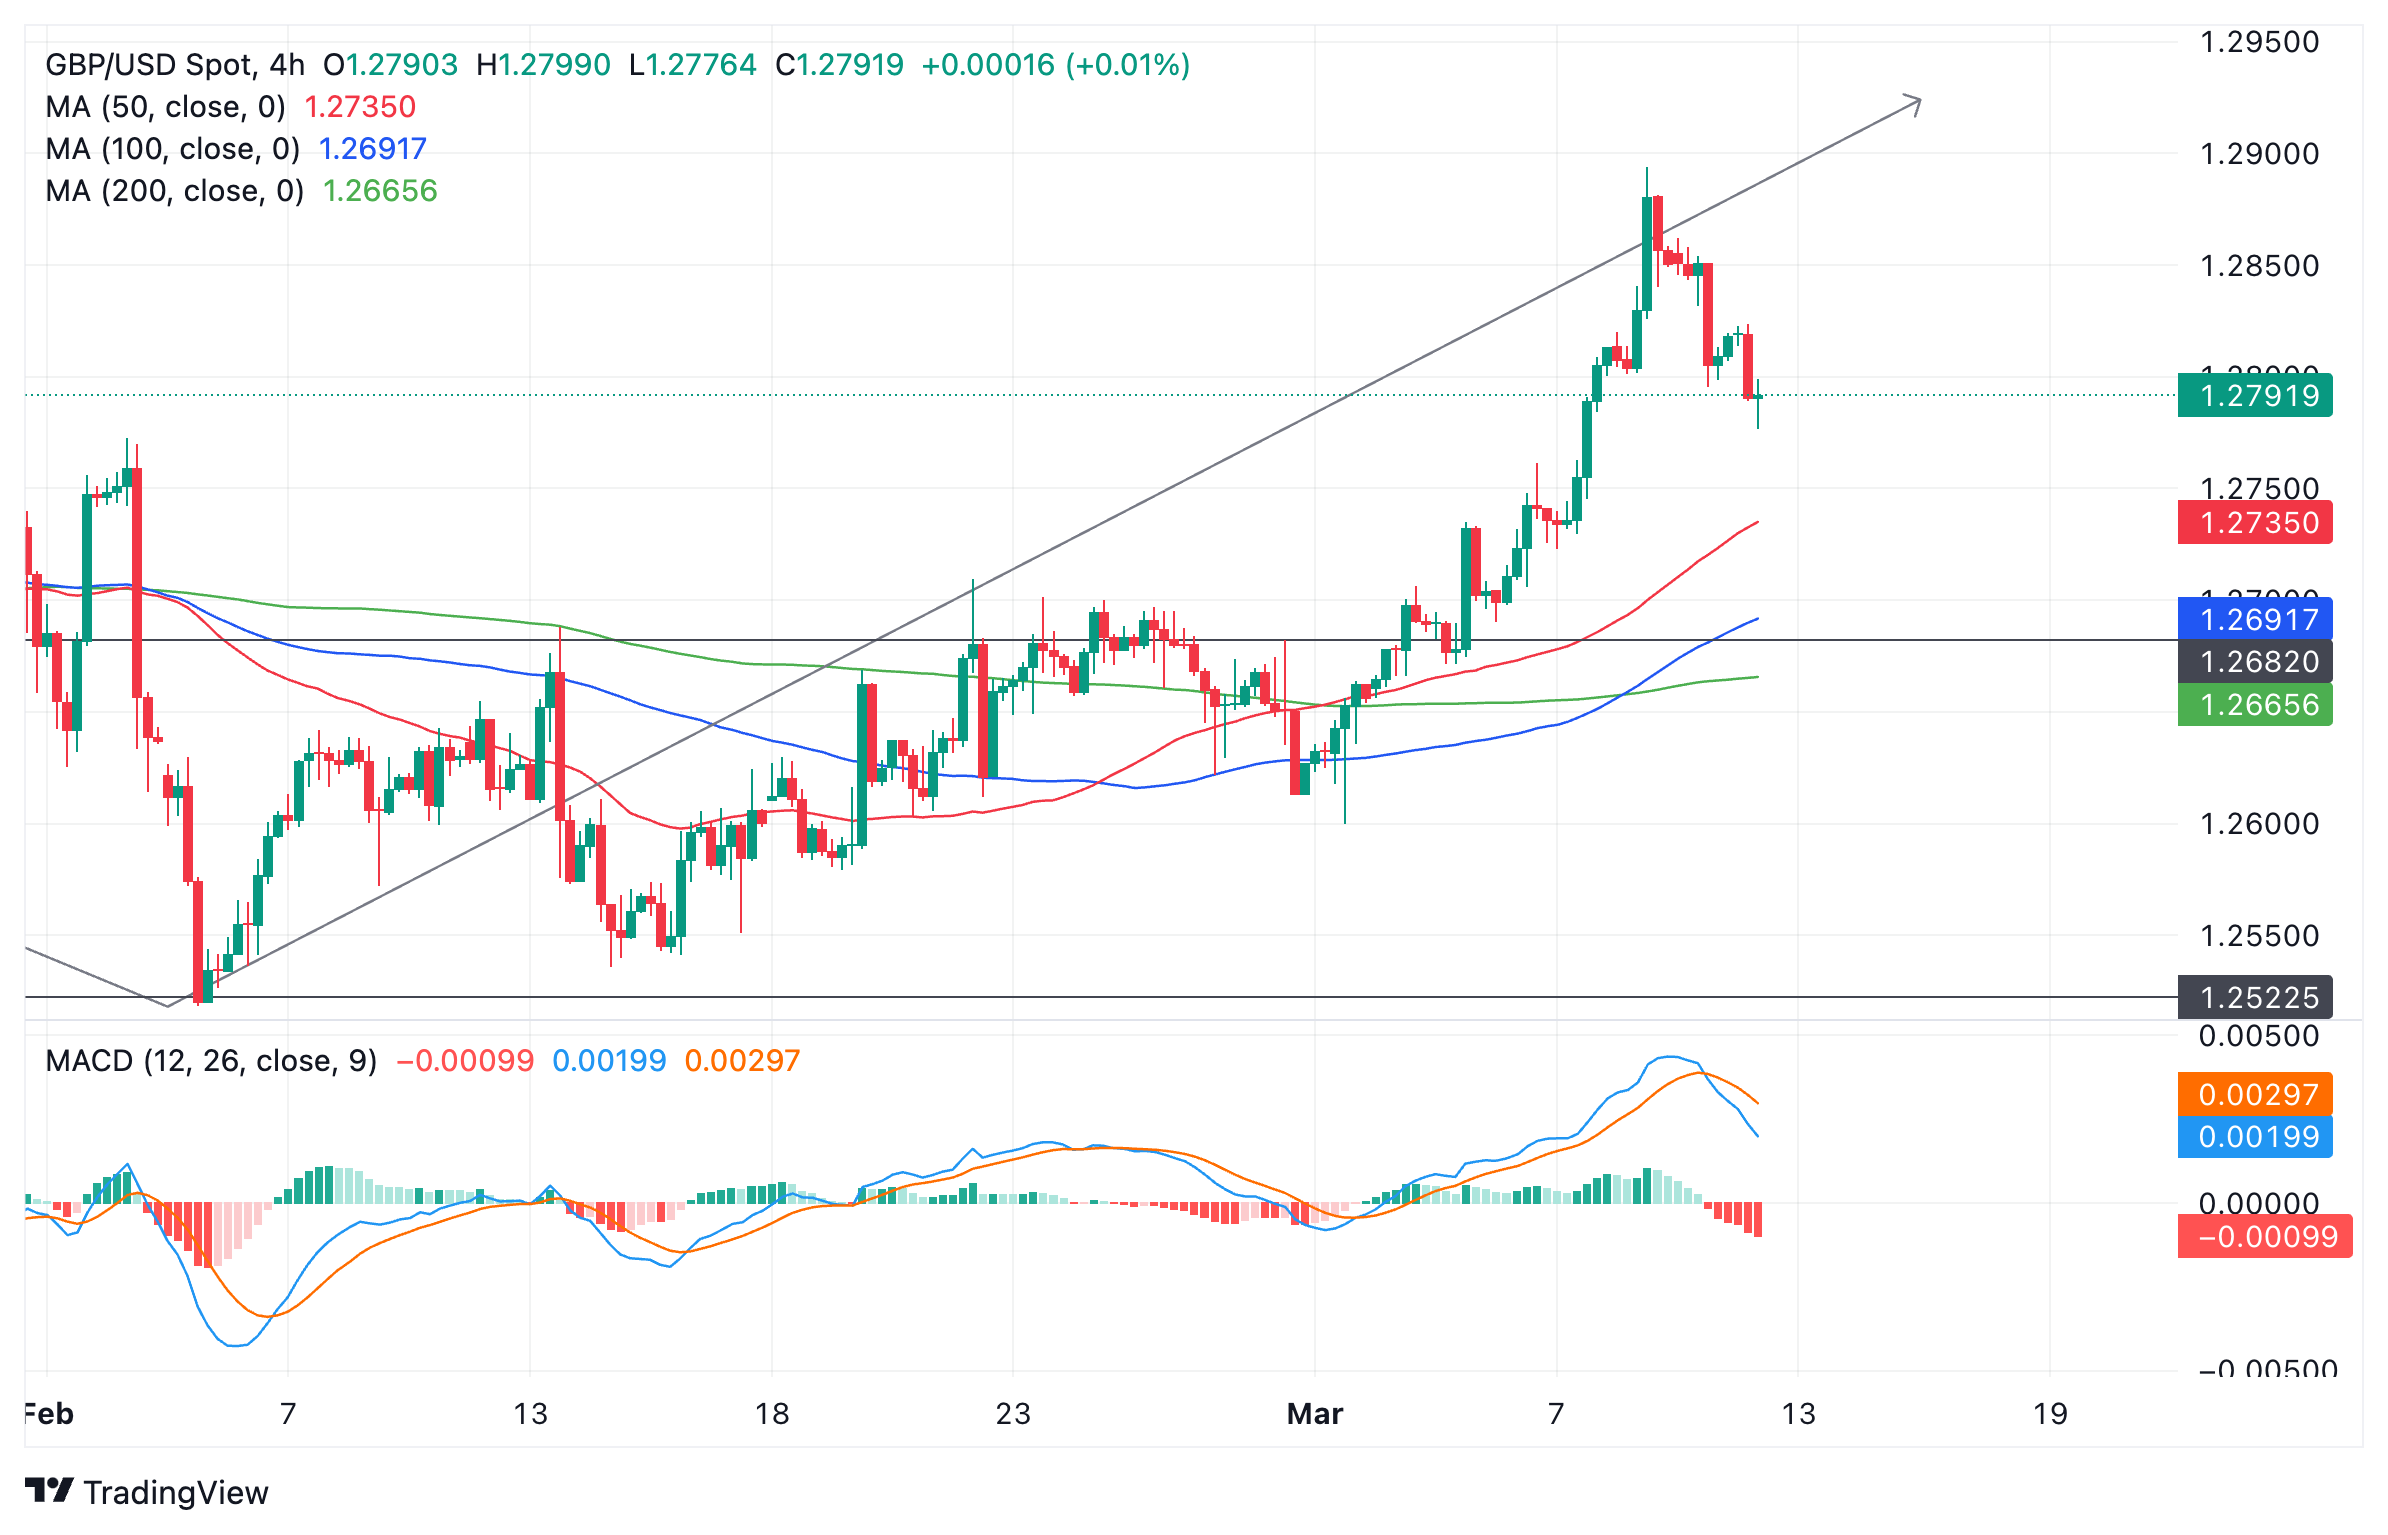
Pound Sterling vs US Dollar: 4-hour chart
GBP/USD has started to slide lower, reversing the rising peaks and troughs. The Moving Average Convergence Divergence (MACD) indicator has also crossed below its signal line offering a bearish sell signal.
The short-term uptrend is, therefore, a little in doubt, however, the fact that momentum on the way down from the March 8 peak has been slower than on the way up continues to favor a pullback rather than reversal thesis.
It is possible this pullback could continue lower to support between 1.2730 (from the 200-4hr SMA) and 1.2680, before turning around.
Traders should watch for a bullish candlestick reversal pattern or peaks and troughs climbing again for a sign the dominant uptrend is resuming. A break above 1.2860, if accompanied by strong momentum, would also suggest bulls are back in the saddle, with targets at the aforementioned ends of Wave C.
A clean break below 1.2680, however, would suggest the trend on a short-term basis has reversed and the pair was going lower again, probably to a target zone back in the lower 1.2600s where the pair was rangbound during February.
Author

Joaquin Monfort
FXStreet
Joaquin Monfort is a financial writer and analyst with over 10 years experience writing about financial markets and alt data. He holds a degree in Anthropology from London University and a Diploma in Technical analysis.


