|

GBP/USD Price Analysis: Cable buyers approach 1.2520 hurdle amid three-day uptrend

  • GBP/USD grinds higher after two-day uptrend, defends bounce off 100-SMA.
  • Firmer RSI (14), sustained trading beyond the key SMAs allow buyers to aim for three-week-old horizontal resistance.
  • Fortnight-old ascending trend line adds to the downside support.

GBP/USD gradually marches towards the key upside hurdle as it grinds higher following a two-day winning streak, floating near 1.2500 during the initial hours of Friday’s Asian session.

In doing so, the Cable pair defends the previous day’s rebound from the 100-bar Simple Moving Average (SMA) while also justifying the firmer Relative Strength Index (RSI), placed at 14, not overbought.

With this, the quote’s further upside towards a horizontal area comprising multiple levels marked since April 04, around 1.2505-20, can’t be ruled out. However, the pair’s additional run-up will depend upon how well it can stay beyond the stated hurdle as the Year-To-Date (YTD) peak surrounding 1.2550 could challenge GBP/USD buyers afterward.

In a case where the Cable pair remains firmer past 1.2550, a run-up towards the May 2022 peak of around 1.2665 becomes appealing.

Meanwhile, pullback moves need to break the 100-SMA support of 1.2440 to convince intraday sellers.

Following that, a fortnight-old ascending support line and the 200-SMA, respectively near 1.2410 and 1.2360, may prod the GBP/USD bears.

It’s worth noting, however, that the GBP/USD pair’s weakness past 1.2360 will make it vulnerable to visiting the monthly low of around 1.2275.

GBP/USD: Four-hour chart

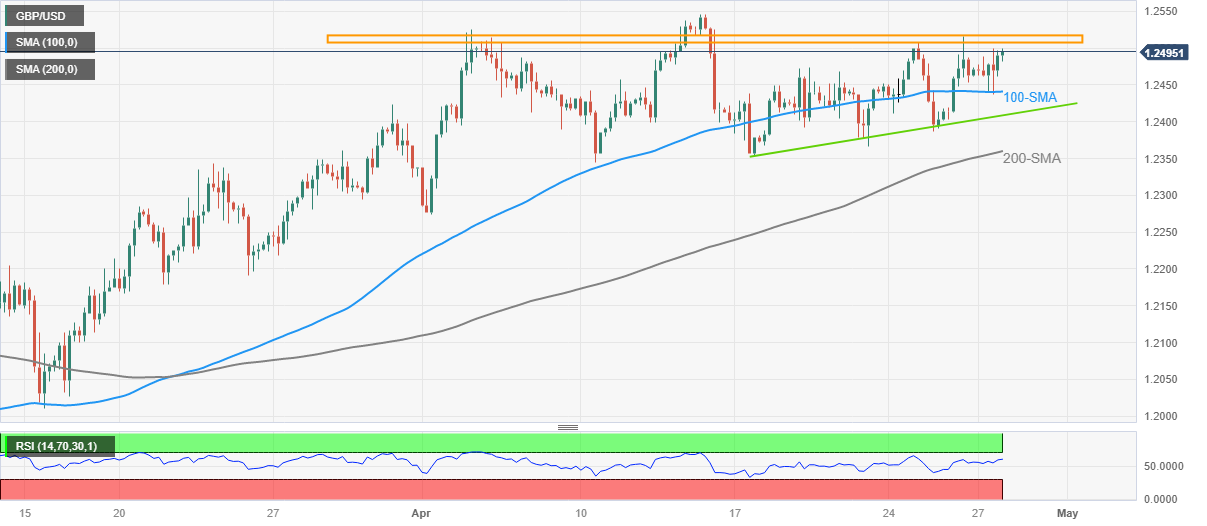
Trend: Further upside expected

Additional important levels

Overview
Today last price1.2496
Today Daily Change0.0026
Today Daily Change %0.21
Today daily open1.247
 
Trends
Daily SMA201.2434
Daily SMA501.223
Daily SMA1001.2206
Daily SMA2001.1934
 
Levels
Previous Daily High1.2516
Previous Daily Low1.2403
Previous Weekly High1.2474
Previous Weekly Low1.2354
Previous Monthly High1.2424
Previous Monthly Low1.1803
Daily Fibonacci 38.2%1.2472
Daily Fibonacci 61.8%1.2446
Daily Pivot Point S11.241
Daily Pivot Point S21.235
Daily Pivot Point S31.2297
Daily Pivot Point R11.2522
Daily Pivot Point R21.2575
Daily Pivot Point R31.2635

Author

Anil Panchal

Anil Panchal

FXStreet

Anil Panchal has nearly 15 years of experience in tracking financial markets. With a keen interest in macroeconomics, Anil aptly tracks global news/updates and stays well-informed about the global financial moves and their implications.

More from Anil Panchal
Share:

Markets move fast. We move first.

Orange Juice Newsletter brings you expert driven insights - not headlines. Every day on your inbox.

By subscribing you agree to our Terms and conditions.

Editor's Picks

EUR/USD off three-month highs, holds near 1.1800 on softer US Dollar

EUR/USD consolidates gains below 1.1800 in the European trading hours on Wednesday. A broadly subdued US Dollar continues to underpin the pair amid quiet markets and thin liquidity conditions on Christmas Eve. 

GBP/USD keeps range around 1.3500 amid quiet markets

GBP/USD keeps its range trade intact at around 1.3500 in the European session on Wednesday. The Pound Sterling holds the upper hand over the US Dollar amid pre-Christmas light trading as traders turn to sidelines heading into the holiday season. 

Gold retreats from record highs amid profit-taking on Christmas Eve

Gold retreats following the move higher to the $4,525 area, or a fresh all-time peak, though the downside remains limited amid a bullish fundamental backdrop. The US Dollar selling bias remains unabated on the back of dovish Fed expectations, which continues to act as a tailwind for the bullion amid persistent geopolitical risks.

Shiba Inu's bears tighten grip, aiming for yearly lows

Shiba Inu price remains under pressure, trading below $0.000070 on Wednesday as bearish momentum continues to dominate the broader crypto market. On-chain and derivatives data further support the bearish sentiment, while technical analysis suggests a deeper correction targeting the yearly lows.

Economic outlook 2026-2027 in advanced countries: Solidity test

After a year marked by global economic resilience and ending on a note of optimism, 2026 looks promising and could be a year of solid economic performance. In our baseline scenario, we expect most of the supportive factors at work in 2025 to continue to play a role in 2026.

Stellar Price Forecast: XLM slips below $0.22 as bearish momentum builds

Stellar (XLM) price is trading below $0.22 at the time of writing on Wednesday after failing to close above the key resistance earlier this week. Bearish momentum continues to strengthen, with open interest falling and short bets rising.