|

GBP/USD Price Analysis: Buyers and sellers jostle below 1.2300

  • GBP/USD looks for clear directions amid broad bearish trend.
  • Monday’s candlestick suggesting a trend reversal, oversold RSI question the sellers.
  • Buyers will wait for a sustained break of 200-day SMA for entry.

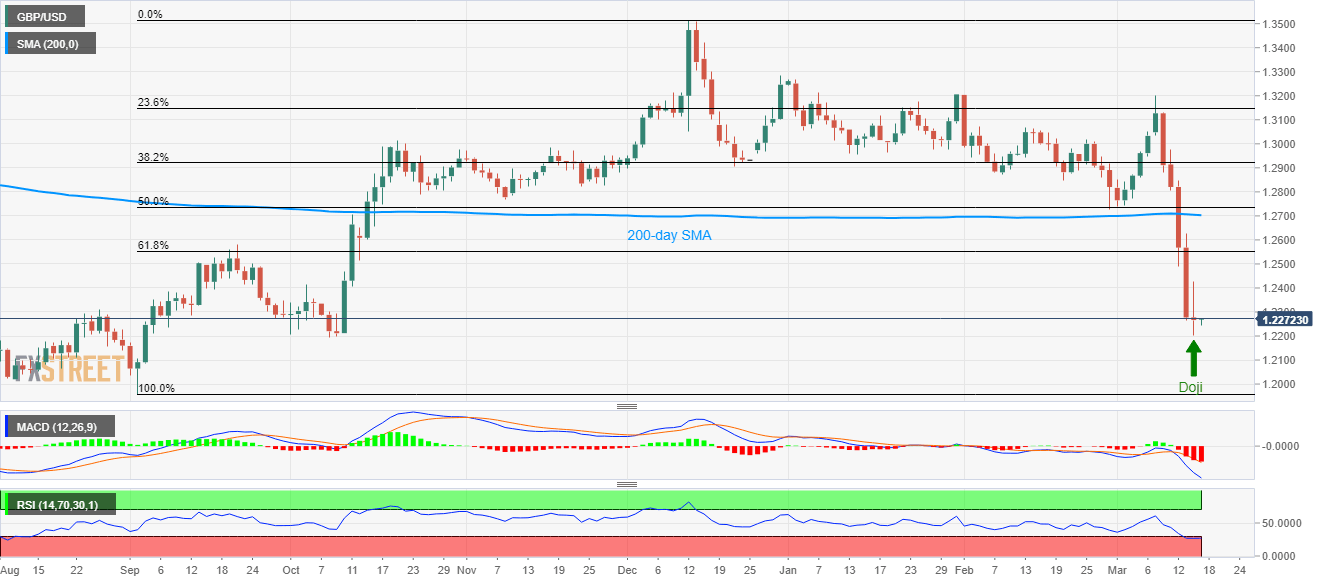
Having flashed a Doji candlestick formation on the daily (D1) chart, GBP/USD seesaws near 1.2270 during the Asian session on Tuesday.

The Cable searches for the clear catalyst as bearish MACD signals and trading below 200-day SMA keeps the sellers in command whereas a candlestick formation indicating trend reversal and oversold RSI pushes the buyers to look for entry.

Monday’s top near 1.2425 and 61.8% Fibonacci retracement of the pair’s September-December 2019 upside, around 1.2555, can offer nearby resistances to the quote ahead of 200-day SMA level of 1.2700.

In a case where the bulls manage to conquer 1.2700, November 2019 bottom surrounding 1.2820 will be on their radars.

Meanwhile, October 219 low near 1.2195 holds the key to the pair’s further downside, which if broken could drag the quote towards 1.2100 and then to September 2019 low surrounding 1.1960.

GBP/USD daily chart

Trend: Pullback expected

Additional important levels

Overview
Today last price1.2267
Today Daily Change-10 pips
Today Daily Change %-0.08%
Today daily open1.2277
 
Trends
Daily SMA201.2873
Daily SMA501.2972
Daily SMA1001.2985
Daily SMA2001.2708
 
Levels
Previous Daily High1.2625
Previous Daily Low1.2264
Previous Weekly High1.3201
Previous Weekly Low1.2264
Previous Monthly High1.3204
Previous Monthly Low1.2726
Daily Fibonacci 38.2%1.2402
Daily Fibonacci 61.8%1.2487
Daily Pivot Point S11.2153
Daily Pivot Point S21.2028
Daily Pivot Point S31.1792
Daily Pivot Point R11.2513
Daily Pivot Point R21.2749
Daily Pivot Point R31.2874

Author

Anil Panchal

Anil Panchal

FXStreet

Anil Panchal has nearly 15 years of experience in tracking financial markets. With a keen interest in macroeconomics, Anil aptly tracks global news/updates and stays well-informed about the global financial moves and their implications.

More from Anil Panchal
Share:

Editor's Picks

EUR/USD: Gains remain capped by 1.1650

EUR/USD remains in recovery-mode following the closing bell in Euroland on Wednesday, hovering around the 1.1650 zone amid renewed downside pressure on the US Dollar and a marginal improvement in the global sentiment.

GBP/USD appears bid around 1.3370

GBP/USD reverses part of its recent multi-day decline, gathering some balance and managing to reach the 1.3400 region, where some initial resistance seems to have turned up. Cable’s uptick comes in response to some loss of momentum in the Greenback despite the geopolitical scenario remaining fragile.

Gold struggles to surpass $5,200

Gold keeps its daily gains well in place, although a break above the $5,200 mark per troy ounce still remains elusive on Wednesday. The yellow metal’s rebound comes in response to the persistent flight-to-safety amid intense geopolitical tensions in the Middle East and the bearish performance of the US Dollar.

Crypto Today: Bitcoin, Ethereum, XRP rebound amid mixed ETF flows

The cryptocurrency market is showing subtle recovery signs despite heightened global uncertainty following the United States (US) and Israel attacks on Iran and the subsequent retaliations that have morphed into a wider Middle East war.

First Venezuela, now Iran: The US-China energy war escalates

At first glance, the latest escalation involving the United States with both Iran and Venezuela looks like another chapter in a long-running geopolitical story. But viewed through a broader strategic lens, something else may be unfolding: Energy.

Bittensor extends recovery despite retail demand slump

Bittensor, a leading Artificial Intelligence token, is aging up above $190 at the time of writing on Wednesday. Steady price increases characterise the broader crypto market, with Bitcoin holding above $71,000 and Ethereum above $2,000.