|

GBP/USD Price Analysis: Bulls on top in the open, but W-formation is compelling

  • GBP/USD bulls are in charge across the charts.
  • Cable is printing a bearish W-formation on the daily chart. 

GBP/USD is a mixed picture for days ahead as the price extends higher but leaves a bearish chart pattern on the daily time frame. 

The following also illustrates the bullish bias on the monthly and weekly charts. 

Monthly chart

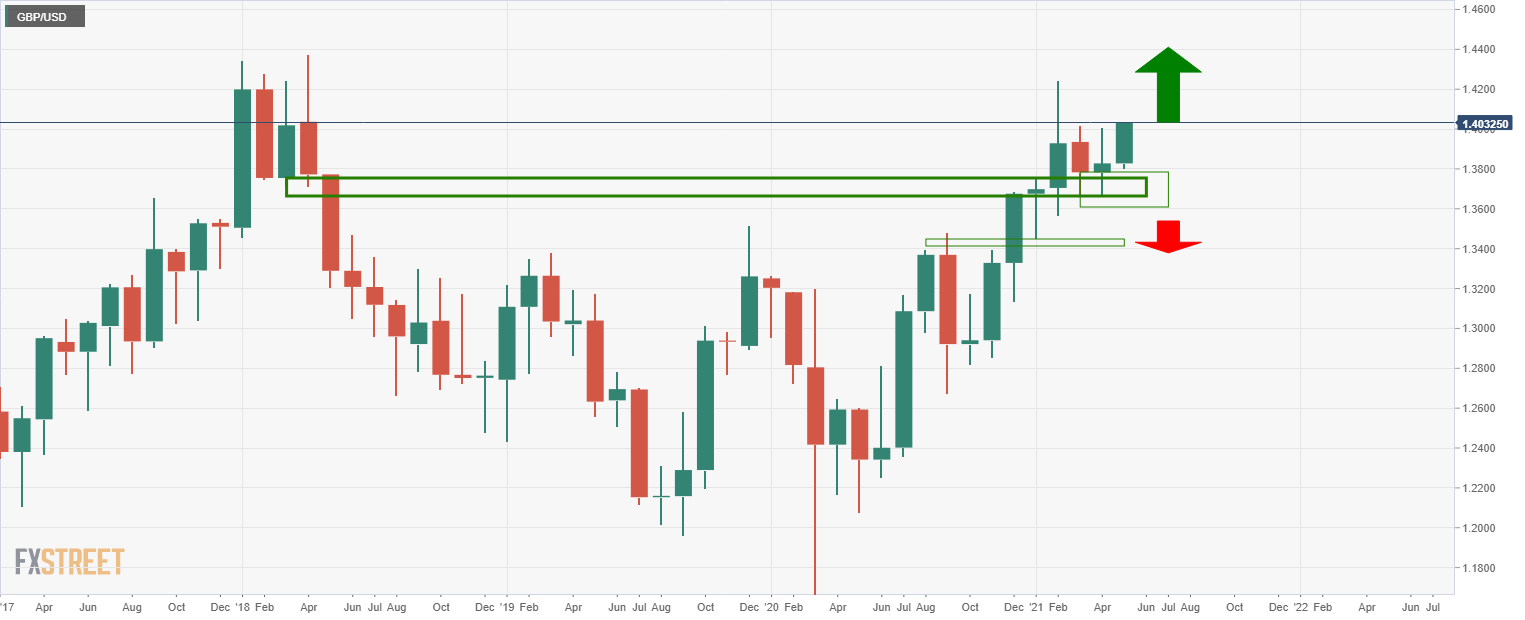
The monthly chart is bullish while above the support structure as the price runs deeper into the supply territory. 

Weekly chart

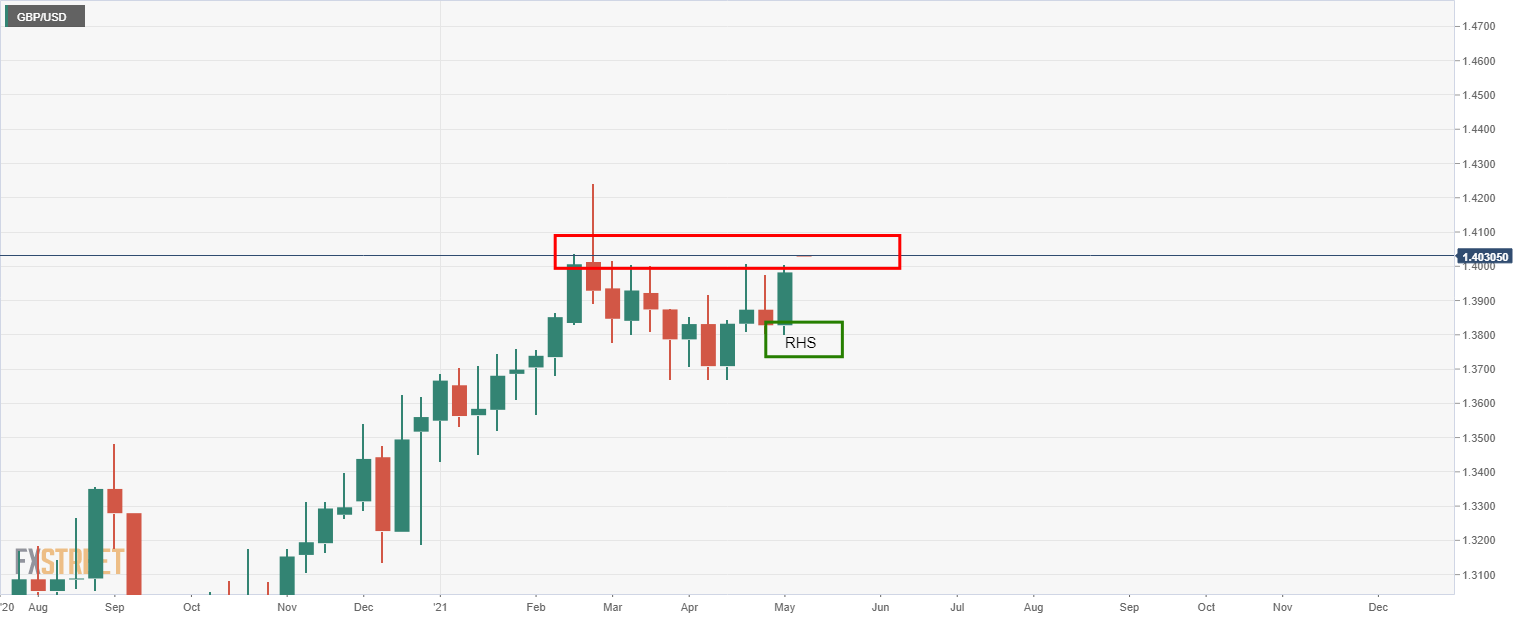
The weekly chart offers a bullish reverse head and shoulders pattern where the price would be expected to run higher and beyond the weekly resistance. 

Daily chart

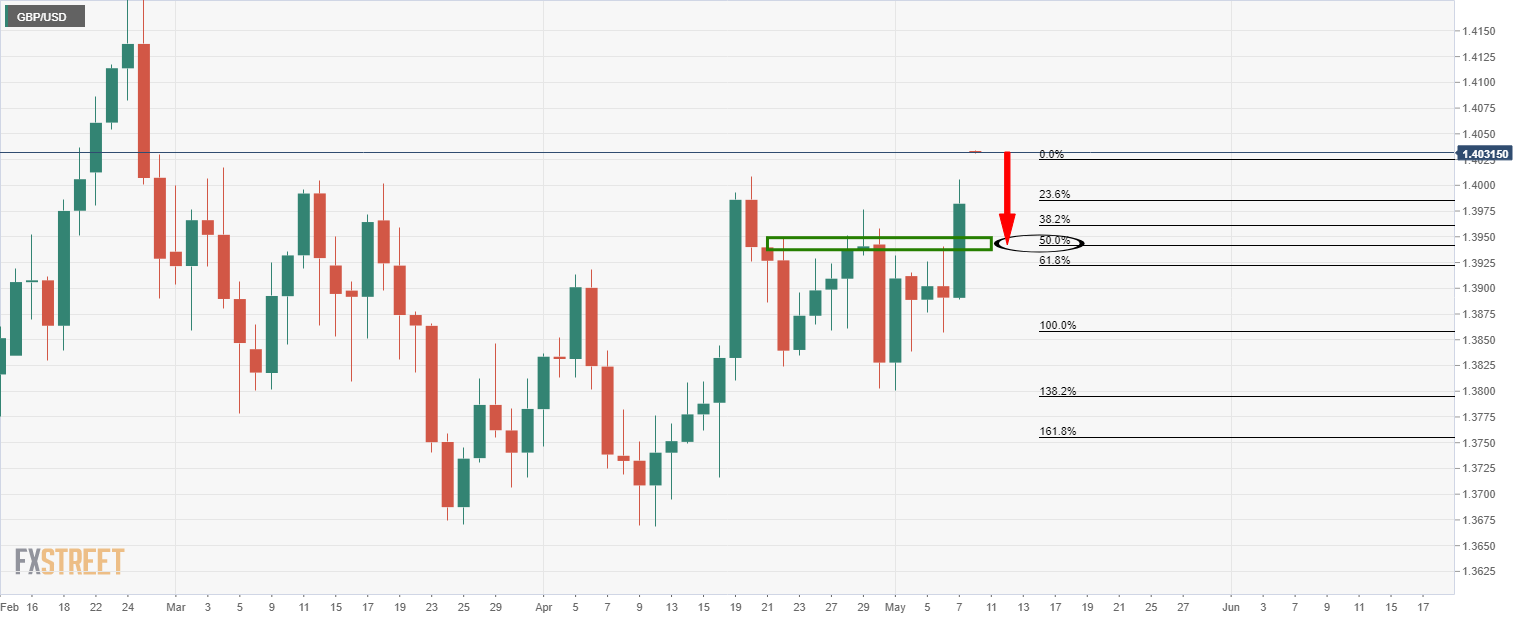
With that being said, there is the scope of a retracement considering the daily W-formation.

The 50% mean reversion aligns with the prior resistance at the neckline of the formation. 

Further reading: GBP/USD flirts with three-week high near 1.4000 as Scottish elections, Brexit test buyers

Author

Ross J Burland

Ross J Burland, born in England, UK, is a sportsman at heart. He played Rugby and Judo for his county, Kent and the South East of England Rugby team.

More from Ross J Burland
Share:

Editor's Picks

EUR/USD weakens below 1.1900, USD remains firm

EUR/USD has slipped back into its downtrend, drifting below the 1.1900 support as the US Dollar’s recovery keeps gathering traction. Indeed, the Greenback’s push higher gathered pace after President Trump named Kevin Warsh as Jerome Powell’s successor and US Producer Prices rose more than expected in December.

GBP/USD retreats further, threatens 1.3700

Selling pressure remains on the rise, dragging GBP/USD back towards three-day lows around 1.3720-1.3710 at the end of the week. Cable’s retracement reflects a firmer rebound in the Greenback as investors digest Trump’s announcement of the next Fed chair.

Gold remains offered just above $5,000

Gold is extending its pullback, managing to trim part of its strong losses and regain the $5,000 mark and beyond on Friday. The precious metal’s severe drop comes amid broad-based profit-taking across the commodity space, alongside a firmer US Dollar and mixed US Treasury yields.

Stellar deepens correction, slipping to 3-month low as risk-off mood persists

Stellar continues to trade in the red, slipping below $0.20 on Friday, a level not seen since mid-October. Bearish sentiment intensifies amid falling Open Interest and negative funding rates in the derivatives market. On the technical side, weakening momentum indicators support further correction in XLM.

Microsoft sell-off etches $400 billion hole in market, second highest on record

Microsoft's (MSFT) post-earnings cratering on Thursday sent other indices into pullback mode despite the narrow nature of its weakness.

Top 3 Price Prediction: Bitcoin, Ethereum, Ripple deepen sell-off as bears take control of momentum

Bitcoin, Ethereum, and Ripple continued their corrections on Friday, posting weekly losses of nearly 6%, 3%, and 5%, respectively. BTC is nearing the November lows at $80,000, while ETH slips below $2,800 amid increasing downside pressure.