|

GBP/USD Price Analysis: Bounces off 50-HMA towards 1.3400

  • GBP/USD fades pullback from the yearly high flashed the previous day.
  • Short-term key SMA questions the pair’s downside break of one-week-old support line.
  • Bearish MACD suggests further weakness, an ascending trend line from August 25 offers additional support.

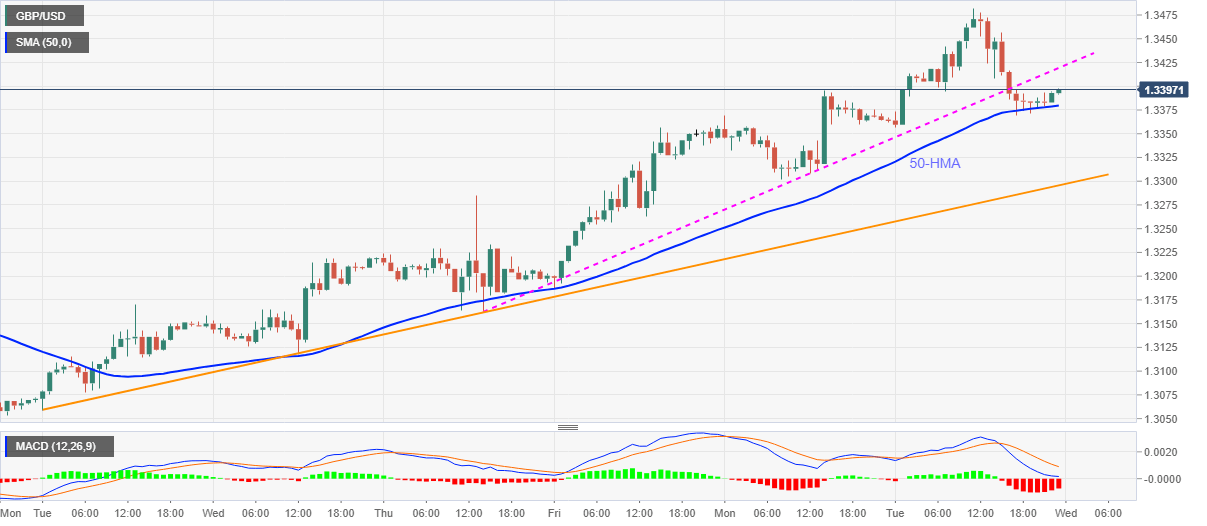
GBP/USD recovers losses from a multi-week high while picking up the bids near 1.3395 before Wednesday’s Tokyo open. The Cable refreshed the highest since December 2019 the previous day with a run-up to 1.3482 but couldn’t stay positive as the following pullback broke an ascending trend line from August 27 and recalled the 1.3369 level. The downbeat performance takes clues from bearish MACD to keep the sellers hopeful.

However, a clear break below the 50-HMA level of 1.3379 becomes necessary for the pair to visit a bit longer support line, at 1.3295 now.

In a case where the bears dominate past-1.3295, multiple levels marked during the late-August around 1.3230 and 1.3160 can entertain the traders.

On the flip side, a clear break of the adjacent resistance line, previous support, near 1.3420, will be enough for the bulls to challenge the latest high around 1.3485 and aim for the 1.3500 threshold.

Though, the quote’s further upside depends upon how well it crosses December 2019 top surrounding 1.3515.

GBP/USD hourly chart

Trend: Pullback expected

Additional important levels

Overview
Today last price1.3395
Today Daily Change26 pips
Today Daily Change %0.19%
Today daily open1.3369
 
Trends
Daily SMA201.3139
Daily SMA501.284
Daily SMA1001.2632
Daily SMA2001.2732
 
Levels
Previous Daily High1.3396
Previous Daily Low1.3301
Previous Weekly High1.3357
Previous Weekly Low1.3054
Previous Monthly High1.3396
Previous Monthly Low1.2982
Daily Fibonacci 38.2%1.336
Daily Fibonacci 61.8%1.3337
Daily Pivot Point S11.3315
Daily Pivot Point S21.3261
Daily Pivot Point S31.3221
Daily Pivot Point R11.341
Daily Pivot Point R21.345
Daily Pivot Point R31.3504

Author

Anil Panchal

Anil Panchal

FXStreet

Anil Panchal has nearly 15 years of experience in tracking financial markets. With a keen interest in macroeconomics, Anil aptly tracks global news/updates and stays well-informed about the global financial moves and their implications.

More from Anil Panchal
Share:

Editor's Picks

EUR/USD looks apathetic around 1.1770

EUR/USD comes under renewed pressure on Tuesday, deflating below the 1.1800 support and reversing two consecutive days of gains. The pair’s decline follows the persistent move higher in the US Dollar, as trade uncertainty dominates the sentiment ahead of President Trump’s SOTU speech.

GBP/USD regains 1.3500 and above

GBP/USD extends its advance for the third day in a row on Tuesday, this time retesting the area beyond the 1.3500 hurdle. Cable’s uptick comes despite decent gains in the Greenback and the dovish message from the BoE’s Bailey at the UK Parliament.

Gold appears offered around $5,150

Gold is giving back a good portion of the recent multi-day rally, receding to the $5,150 zone per troy ounce amid the decent bounce in the US Dollar and mixed US Treasuty yields. In the meantime, markets’ attention remain on upcoming comments from Fed speakers.

Ripple’s DeFi shift in focus: Navigating XRPL EVM sidechain growth, XRPFi migration and liquidity

Ripple (XRP) has continued to trade under pressure, extending its decline by approximately 63% from the record high of $3.66 in July. The remittance token is trading above support at $1.35, while its upside appears limited by key supply zones, starting with $1.40, at the time of writing on Tuesday.

The Citrini report: How a debatable AI narrative can shake Wall Street

That AI-related headline alone was enough to rattle investors.US stocks slid sharply on Monday after a widely circulated Citrini Research memo outlined a hypothetical “2028 Global Intelligence Crisis”, warning that rapid AI adoption could push US unemployment into double digits as early as by mid-2028.

XRP pressured by weak ETF flows and declining retail interest

Ripple (XRP) is edging lower, trading above its intraday low of $1.32 at the time of writing on Tuesday. The decline from its weekly opening of $1.39 reflects heightened volatility in the broader cryptocurrency market, accentuated by tariff-triggered uncertainty.