|

GBP/USD Price Analysis: A breakout of triangle looks likely amid positive market impulse

  • GBP/USD is hovering near the edge of the Symmetrical Triangle pattern for a breakout.
  • Economic events such as the US Inflation and the UK employment data might keep Cable volatile.
  • The RSI (14) is oscillating in the bullish range of 60.00-80.00, which indicates that the upside momentum is already active.

The GBP/USD pair has refreshed its day’s high above the critical resistance of 1.2150 in the Asian session. The Cable has picked strength amid the improved risk appetite of investors after they digested the United States inflation-inspired anxiety.

S&P500 futures are displaying a subdued performance after a bullish Monday, portraying a minor caution amid overall positive sentiment. The US Dollar Index (DXY) has further dropped below 102.85, showing a sheer decline in the safe-haven’s appeal. The Pound Sterling will display a power-pack action after the release of the United Kingdom employment data.

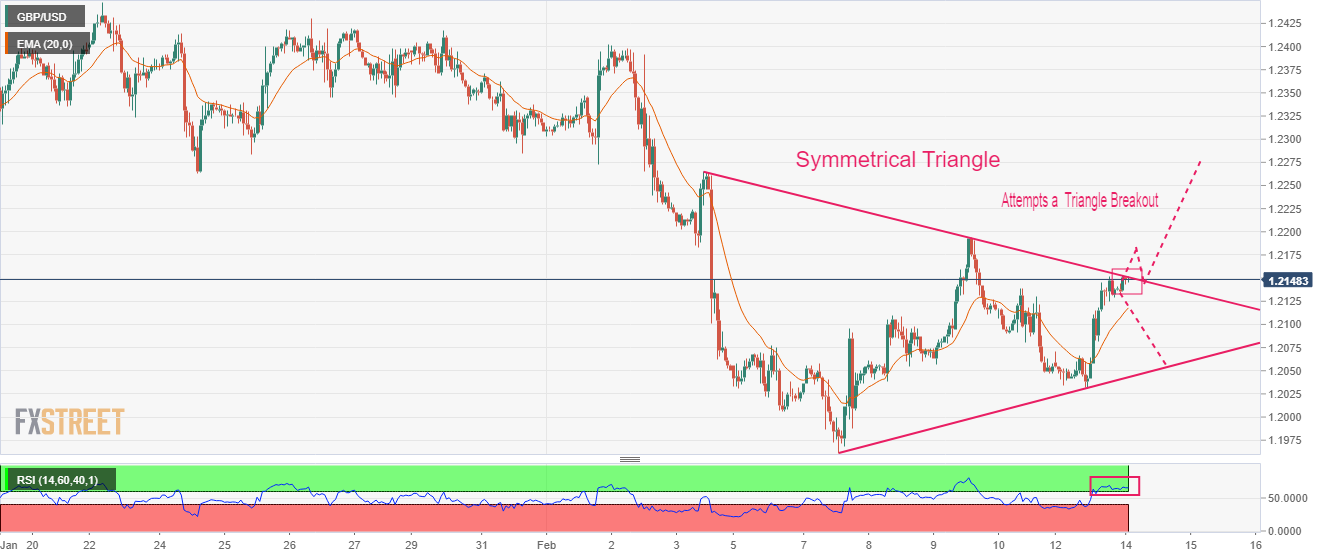
GBP/USD is hovering near the edge of the Symmetrical Triangle chart pattern formed on an hourly scale. The upward-sloping trendline of the aforementioned chart pattern is placed from February 7 low at 1.1961 while the downward-sloping trendline is plotted from February 3 high at 1.2264.

 Advancing 20-period Exponential Moving Average (EMA) at 1.2118, adds to the upside filters.

The Relative Strength Index (RSI) (14) is oscillating in the bullish range of 60.00-80.00, which indicates that the upside momentum is already active.

A confident breakout of the Symmetrical Triangle above February 9 high at 1.2192 will trigger the volatility expansion, which will drive the asset toward February 3 high at 1.2264. A breach of the latter will expose the asset to the round-level resistance of 1.2300.

On the contrary, a decline in the Cable below February 9 low at 1.2057 will drag the asset toward January 3 low at 1.1900 followed by horizontal support placed from January 6 low around 1.1841.

GBP/USD hourly chart

GBP/USD

Overview
Today last price1.215
Today Daily Change0.0012
Today Daily Change %0.10
Today daily open1.2138
 
Trends
Daily SMA201.2254
Daily SMA501.2186
Daily SMA1001.1859
Daily SMA2001.1944
 
Levels
Previous Daily High1.2152
Previous Daily Low1.2031
Previous Weekly High1.2194
Previous Weekly Low1.1961
Previous Monthly High1.2448
Previous Monthly Low1.1841
Daily Fibonacci 38.2%1.2106
Daily Fibonacci 61.8%1.2077
Daily Pivot Point S11.2062
Daily Pivot Point S21.1986
Daily Pivot Point S31.1941
Daily Pivot Point R11.2183
Daily Pivot Point R21.2228
Daily Pivot Point R31.2304

Author

Sagar Dua

Sagar Dua

FXStreet

Sagar Dua is associated with the financial markets from his college days. Along with pursuing post-graduation in Commerce in 2014, he started his markets training with chart analysis.

More from Sagar Dua
Share:

Editor's Picks

EUR/USD looks to regain the 200-day SMA

EUR/USD regains some balance and trade just above 1.1600 the figure ahead of the opening bell in Asia. The pair initially dipped to the 1.1530 zone for the first time since November, always following the stronger US Dollar and the marked flight-to-safety in the context of the ongoing Middle East crisis
 

GBP/USD slips below key averages as geopolitical risks mount

GBP/USD fell about 0.35% on Tuesday, settling around 1.3350 after slipping below the 200-day Exponential Moving Average for the first time since early December. The pair has pulled back sharply from its late-January high near 1.3870, shedding over 500 pips in a series of lower highs and lower lows. 

Gold falls to near $5,100 as inflation fears weigh amidst Middle East conflict

Gold price faces some selling pressure near $5,100 during the early Asian session on Wednesday. The precious metal falls amid a renewed US Dollar demand and dimming prospects for US rate cuts. The US ISM Services Purchasing Managers Index report will be published later on Wednesday. 

Ethereum: Whales step up buying as short positions contract

After holding firm heading into the last weekend, Ethereum whales have returned to action, pouncing on the volatility stemming from escalating military actions between the US and Iran.

Energy shock 2.0: Why rising Gas prices could hit the Euro

Even without a confirmed, sustained disruption, the mere risk to a key global energy chokepoint is enough to inject a significant premium into European Gas markets. And for the Euro, that matters.

Ripple falters amid sell-off jitters and negative funding rates

Ripple (XRP) has come under pressure, drifting lower to $1.35 at the time of writing on Tuesday. The over 2% correction looks poised to erase the previous day’s gains, which lifted the remittance token to $1.42.