|
GBP/JPY Technical Analysis: 144.75 becomes crucial for buyers

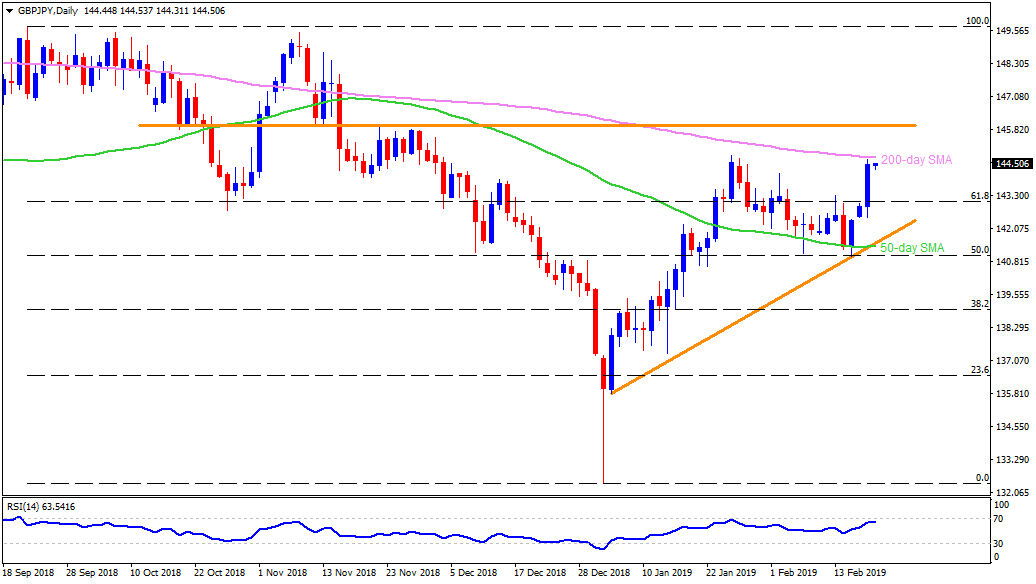
GBP/JPY daily chart
- The GBP/JPY pair trades little changed at 144.50 on early Wednesday.
- The pair rose during the last three days but is still trading under 200-day simple moving average (SMA) figure of 144.75.
- It should also be noted that the pair couldn’t cross 144.75 on a daily closing basis during its recent advances in late-January.
- In case prices rally past-144.75 on a daily closing, 145.50 may offer intermediate halt before highlighting 146.00 horizontal-line resistance.
- On the downside, February 04 high around 144.15 can act as immediate support for the pair, a break of which can fetch the quote to 61.8% Fibonacci retracement of September – January downturn, at 143.00.
- During the pair’s additional declines under 143.00, 142.50 could become a small halt whereas 141.45-40 support-confluence, including 50-day SMA and an ascending trend-line, could limit further downside.
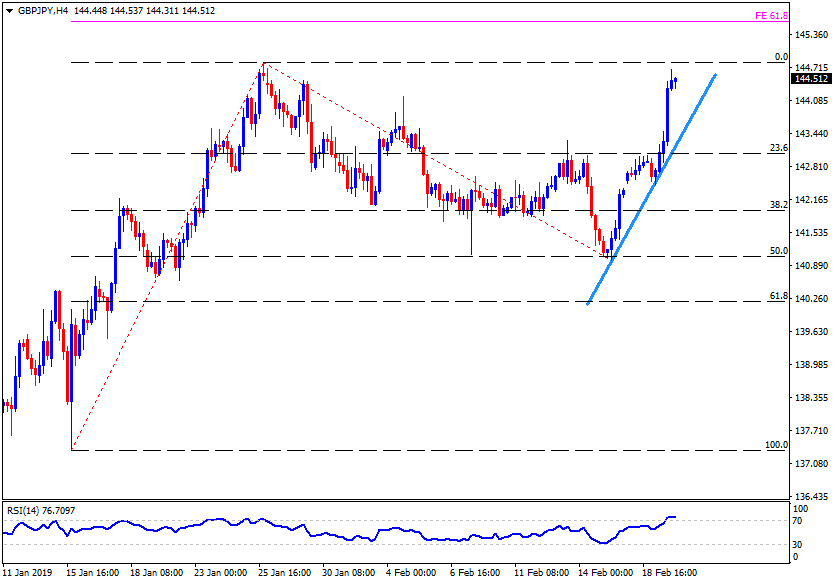
GBP/JPY 4-Hour chart
- On H4, the pair needs to cross the late-January high near 144.85 when 14-bar relative strength index (RSI) is already overbought.
- If the pair rallies past-144.85, 61.8% Fibonacci expansion of its one month move ending on mid-February, at 145.60, can please buyers.
- Alternatively, 143.55 and immediate upward sloping trend-line, at 143.20, seem adjacent supports for the pair ahead of looking at 141.90 as a rest.
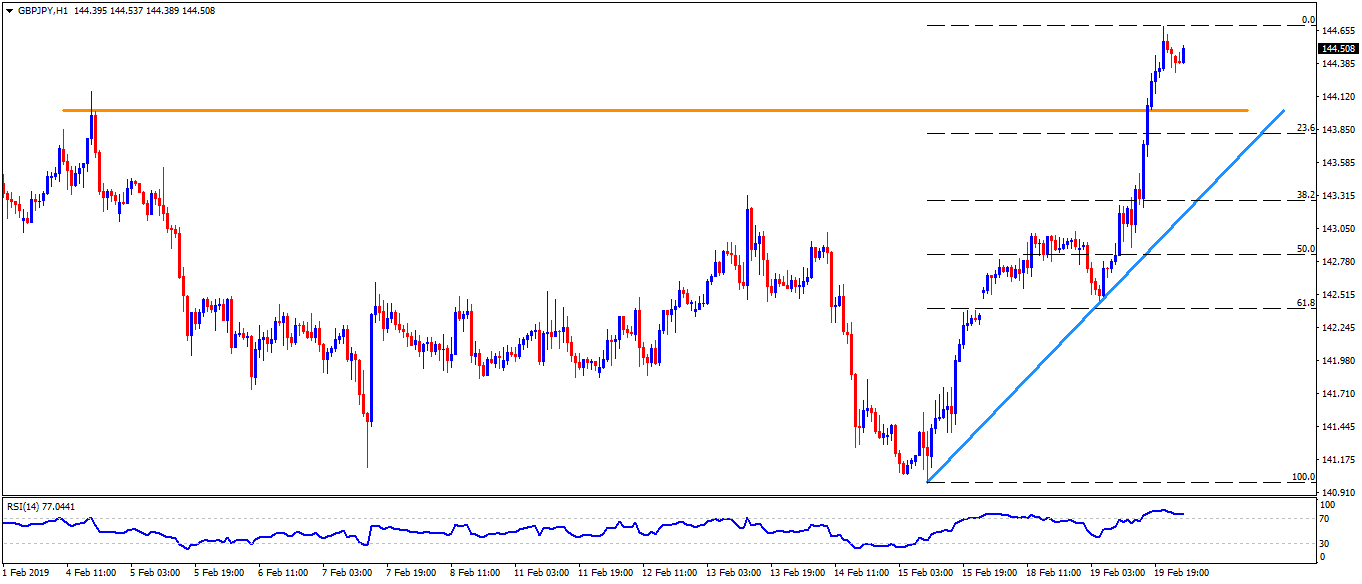
GBP/JPY hourly chart
- Recent high of 144.70 becomes nearby resistance for the pair prior to confronting the 144.85 and the 145.50
- Meanwhile, 144.00 can act as immediate support, a break of which could drag the pair to 143.20 support-line whereas 143.00 and 142.50 might precede 141.90 rest-point.
Author

Anil Panchal
FXStreet
Anil Panchal has nearly 15 years of experience in tracking financial markets. With a keen interest in macroeconomics, Anil aptly tracks global news/updates and stays well-informed about the global financial moves and their implications.
More from Anil Panchal


