|

GBP/JPY Price Analysis: Further upside hinges on 166.30 breakout, UK data

  • GBP/JPY defends three-month-old resistance breakout amid bullish MACD signals.
  • Horizontal area from late June challenge immediate upside moves.
  • The key DMA confluence challenges bears, buyers can aim for yearly top.

GBP/JPY picks up bids to consolidate the previous day’s losses around 165.80 during Monday’s Asian session.

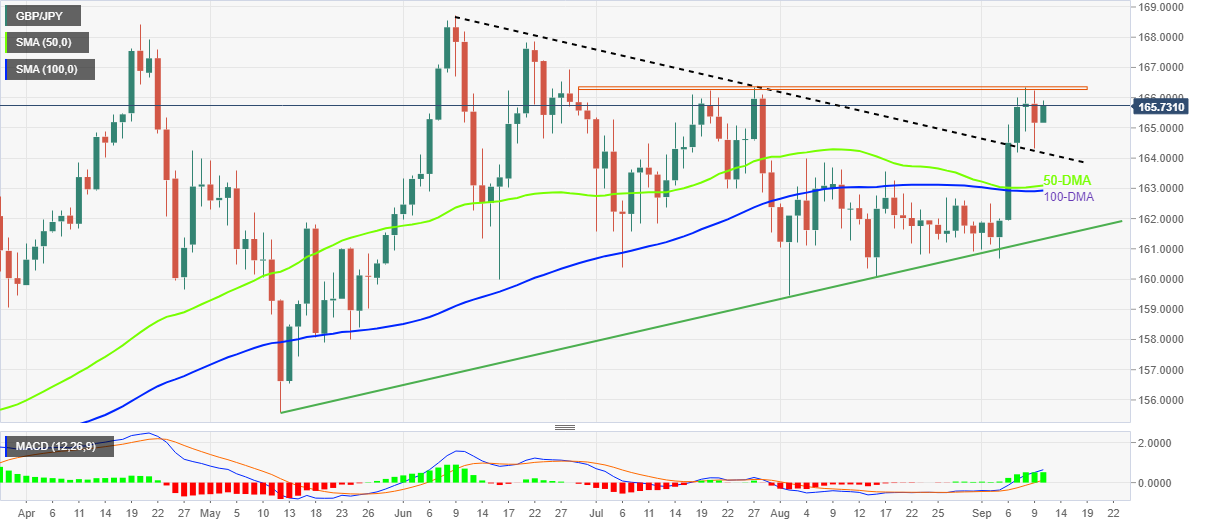
In doing so, the cross-currency pair defends the upside break of a three-month-old resistance, now support around 164.15.

Not only the key resistance breakout but the bullish MACD signals also favor GBP/JPY bulls to portray another run-up towards crossing a 10-week-old horizontal resistance area surrounding 166.30.

It should, however, be noted that the pair’s upside past 166.30 won’t hesitate to challenge the yearly peak surrounding 168.50. During the anticipated run-up, the tops marked in late June and April, respectively around 167.85 and 168.40, could act as buffers.

On the flip side, GBP/JPY sellers may not risk fresh entries until witnessing a clear downside break of the resistance-turned-support line around 164.15, as well as the 164.00 threshold.

Also acting as the key downside barrier is the convergence of the 50-DMA and the 100-DMA around 163.00.

In a case where GBP/JPY sellers keep reins past 163.00, an upward sloping support line from May 12, close to 161.30, followed by the 160.00 psychological magnet, will pop up on the radar.

GBP/JPY: Daily chart

Trend: Further upside expected

Additional important levels

Overview
Today last price165.83
Today Daily Change0.66
Today Daily Change %0.40%
Today daily open165.17
 
Trends
Daily SMA20162.53
Daily SMA50163.07
Daily SMA100162.91
Daily SMA200159.68
 
Levels
Previous Daily High166.24
Previous Daily Low164.31
Previous Weekly High166.32
Previous Weekly Low160.66
Previous Monthly High163.99
Previous Monthly Low159.45
Daily Fibonacci 38.2%165.05
Daily Fibonacci 61.8%165.51
Daily Pivot Point S1164.24
Daily Pivot Point S2163.31
Daily Pivot Point S3162.31
Daily Pivot Point R1166.17
Daily Pivot Point R2167.18
Daily Pivot Point R3168.11

Author

Anil Panchal

Anil Panchal

FXStreet

Anil Panchal has nearly 15 years of experience in tracking financial markets. With a keen interest in macroeconomics, Anil aptly tracks global news/updates and stays well-informed about the global financial moves and their implications.

More from Anil Panchal
Share:

Editor's Picks

EUR/USD looks apathetic around 1.1770

EUR/USD comes under renewed pressure on Tuesday, deflating below the 1.1800 support and reversing two consecutive days of gains. The pair’s decline follows the persistent move higher in the US Dollar, as trade uncertainty dominates the sentiment ahead of President Trump’s SOTU speech.

GBP/USD regains 1.3500 and above

GBP/USD extends its advance for the third day in a row on Tuesday, this time retesting the area beyond the 1.3500 hurdle. Cable’s uptick comes despite decent gains in the Greenback and the dovish message from the BoE’s Bailey at the UK Parliament.

Gold appears offered around $5,150

Gold is giving back a good portion of the recent multi-day rally, receding to the $5,150 zone per troy ounce amid the decent bounce in the US Dollar and mixed US Treasuty yields. In the meantime, markets’ attention remain on upcoming comments from Fed speakers.

Ripple’s DeFi shift in focus: Navigating XRPL EVM sidechain growth, XRPFi migration and liquidity

Ripple (XRP) has continued to trade under pressure, extending its decline by approximately 63% from the record high of $3.66 in July. The remittance token is trading above support at $1.35, while its upside appears limited by key supply zones, starting with $1.40, at the time of writing on Tuesday.

The Citrini report: How a debatable AI narrative can shake Wall Street

That AI-related headline alone was enough to rattle investors.US stocks slid sharply on Monday after a widely circulated Citrini Research memo outlined a hypothetical “2028 Global Intelligence Crisis”, warning that rapid AI adoption could push US unemployment into double digits as early as by mid-2028.

XRP pressured by weak ETF flows and declining retail interest

Ripple (XRP) is edging lower, trading above its intraday low of $1.32 at the time of writing on Tuesday. The decline from its weekly opening of $1.39 reflects heightened volatility in the broader cryptocurrency market, accentuated by tariff-triggered uncertainty.