|

GBP/JPY Price Analysis: Dribbles above 162.00 inside bearish channel after UK Retail Sales

  • GBP/JPY pares intraday gains after mixed UK Retail Sales for July.
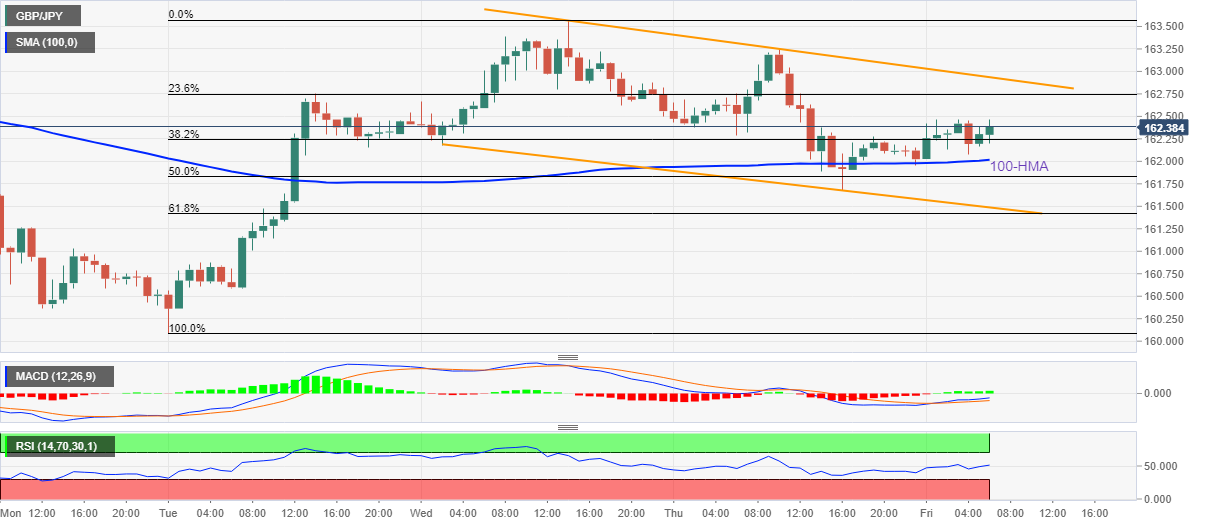
  • RSI (14) also justifies a pullback towards 100-HMA but bullish MACD signals challenge further downside view.
  • Bulls need to defy the three-day-old descending  trend channel to retake control.

GBP/JPY consolidates daily gains around 162.30 after the UK’s Retail Sales probed Sterling Pound buyers during the early Friday morning in Europe. In doing so, the cross-currency pair remains inside an immediate bearish trend channel.

That said, UK’s Retail Sales for July dropped to -3.4% YoY versus -3.3% expected and downwardly revised -6.1% prior. However, the details appeared to be promising but failed to favor the GBP/JPY rebound.

Also read:

It’s worth noting, however, that the 100-HMA joins the bullish MACD signals to defend GBP/JPY buyers around the 162.00 threshold inside a bearish chart pattern.

Following that, the stated channel’s support line near 161.50 could gain the market’s attention.

In a case where GBP/JPY defies the channel formation by declining below 161.50, a downward trajectory towards the monthly low near 159.45 can’t be ruled out.

Alternatively, recovery moves become interesting on crossing the channel’s upper line, at 163.00 by the press time, while targeting the monthly peak near 164.00.

GBP/JPY: Hourly chart

Trend: Limited downside expected

Additional important levels

Overview
Today last price162.31
Today Daily Change0.19
Today Daily Change %0.12%
Today daily open162.12
 
Trends
Daily SMA20162.79
Daily SMA50163.83
Daily SMA100163.1
Daily SMA200158.86
 
Levels
Previous Daily High163.25
Previous Daily Low161.67
Previous Weekly High163.85
Previous Weekly Low161.27
Previous Monthly High166.34
Previous Monthly Low160.4
Daily Fibonacci 38.2%162.27
Daily Fibonacci 61.8%162.65
Daily Pivot Point S1161.44
Daily Pivot Point S2160.77
Daily Pivot Point S3159.87
Daily Pivot Point R1163.02
Daily Pivot Point R2163.92
Daily Pivot Point R3164.59

Author

Anil Panchal

Anil Panchal

FXStreet

Anil Panchal has nearly 15 years of experience in tracking financial markets. With a keen interest in macroeconomics, Anil aptly tracks global news/updates and stays well-informed about the global financial moves and their implications.

More from Anil Panchal
Share:

Editor's Picks

EUR/USD falls to near 1.1600 due to persistent bearish bias

EUR/USD depreciates after registering modest gains in the previous session, trading around 1.1610 during the Asian hours on Thursday. The technical analysis of the daily chart suggests a persistent bearish bias as the EUR/USD pair remains within the descending channel pattern.

GBP/USD underperforms as UK faces stagflation risks amid Middle East war

The Pound Sterling trades lower against its major currency peers, is down 0.22% around 1.3340 against the US Dollar, during the Asian trade on Thursday. The British currency faces selling pressures amid fears that the United Kingdom economy could face stagflation risks due to higher energy prices, a situation in which inflation accelerates with economic growth and employment conditions remaining stagnant.

Gold climbs near $5,200 as Iran war fuels safe-haven demand

Gold price extends its gains for the second successive session on Thursday as traders seek safety amid the ongoing war in the Middle East. US and Israeli strikes across Iranian territory and widespread Iranian missile and drone retaliation across the Middle East, including attacks on regional targets and military sites, prolong the crisis and its impact.

Top Crypto Gainers: Decred, Zcash, and Dogecoin lead recovery as Bitcoin crosses $72,000

Bitcoin trades above $72,500 at press time on Thursday, holding its 6% gain from the previous day, contributing to a broader market recovery. The total cryptocurrency market capitalization stands at over $2.43 trillion as the broader market sentiment improves significantly.

First Venezuela, now Iran: The US-China energy war escalates

At first glance, the latest escalation involving the United States with both Iran and Venezuela looks like another chapter in a long-running geopolitical story. But viewed through a broader strategic lens, something else may be unfolding: Energy.

Cardano Price Analysis: Approaches key trendline amid bearish sentiment

Cardano (ADA) price is approaching its descending trendline around $0.28 at the time of writing, set to shape the next directional move. The derivatives metrics paint a bearish picture, with ADA’s Open Interest continuing to fall and short bets rising among traders.