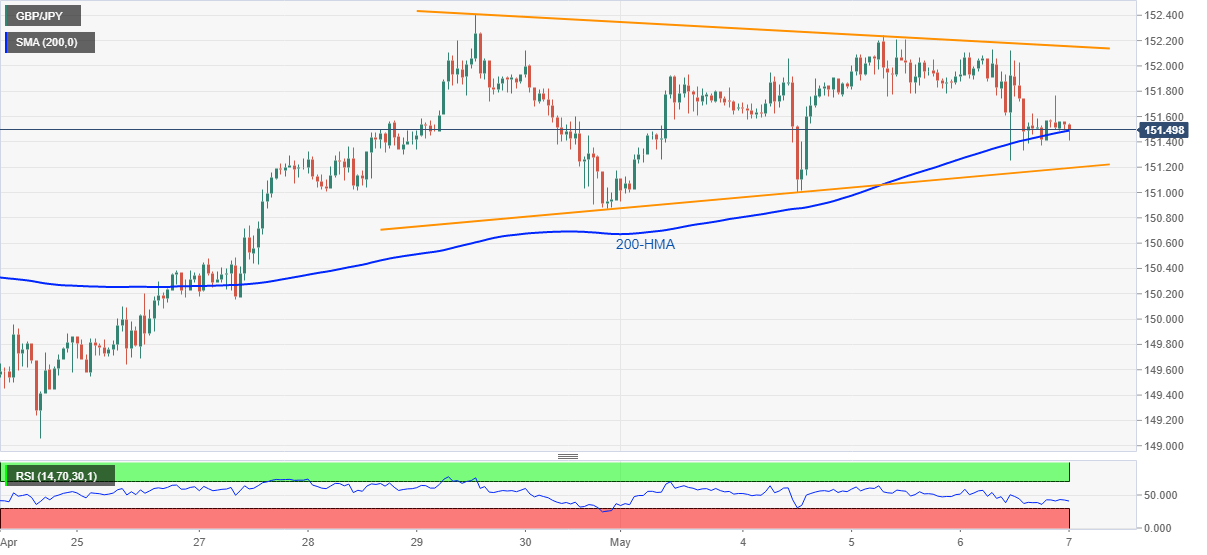
GBP/JPY Price Analysis: Clings to 200-HMA inside weekly triangle
- GBP/JPY remains pressured around the key moving average.
- Downbeat RSI favors bears but symmetrical triangle restricts immediate moves.
- Bulls have a bumpy road beyond the triangle.

GBP/JPY eases to 151.50, down 0.06% intraday, amid the initial hour of Friday’s Tokyo open. The pair recently dropped amid news of the Japanese government’s readiness to extend the virus-led emergency towards the May end. However, 200-HMA restricts nearby moves of GBP/JPY inside the one-week-old symmetrical triangle.
Read: USD/JPY: Three-day downtrend tests 109.00 as Japan aims to extend virus-led emergency
Given the downward sloping RSI and risk-negative news from Japan, GBP/JPY may slip beneath the immediate 149.48 HMA support. Though, the stated triangle’s support near 151.20 and the 151.00 round-figure could test the sellers afterward.
Even if the cross-currency pair declines below 151.00, the weekly bottom of 150.88 adds a filter to the downside targeting the 150.00 psychological magnet.
Meanwhile, 151.80 and the 152.00 threshold can entertain short-term buyers during the corrective pullback.
If at all the GBP/JPY prices remain firm beyond 152.00, the stated triangle’s resistance line near 152.20 and late April top near 152.40 will precede the 153.00 resistance level, not to forget the yearly peak of 153.41.
GBP/JPY hourly chart
Trend: Further weakness expected
Author

Anil Panchal
FXStreet
Anil Panchal has nearly 15 years of experience in tracking financial markets. With a keen interest in macroeconomics, Anil aptly tracks global news/updates and stays well-informed about the global financial moves and their implications.


