GBP/JPY Price Analysis: Bulls approach key EMAs during seven-day rise
- GBP/JPY takes the bids near three week high above 136.50.
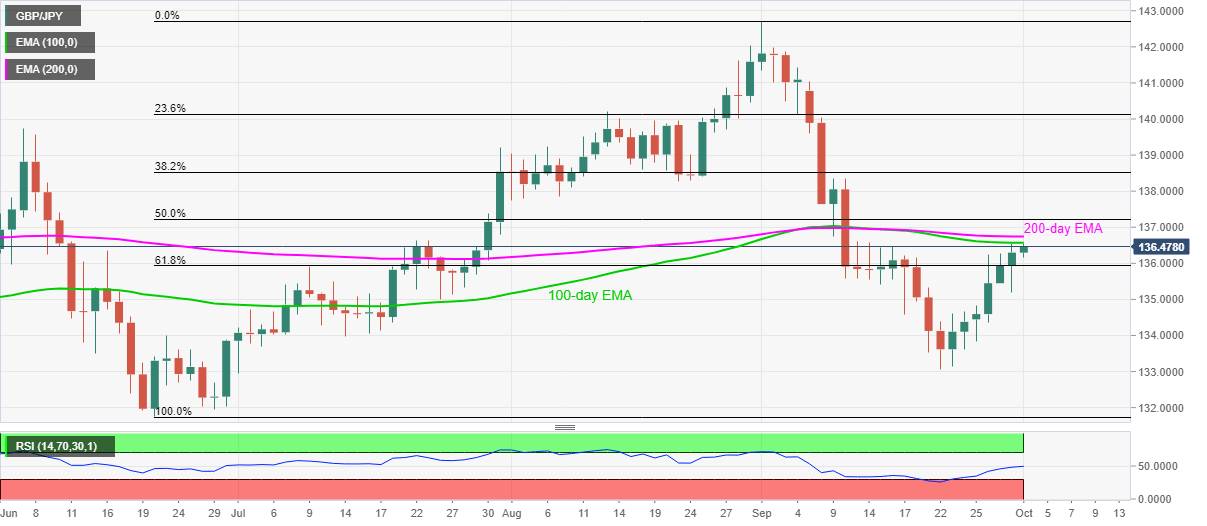
- 100-day and 200-day EMA probe the pair’s sustained break of 61.8% Fibonacci retracement.
- RSI recovery from oversold conditions suggests further upside.

GBP/JPY refreshes the multiday high while rising to 136.56 during the early Thursday. In doing so, the pair keeps the previous day’s run-up beyond 61.8% Fibonacci retracement of June-September upside while confronting the 100-day EMA.
Although recovery in RSI indicates the pair’s ability to cross the immediate EMA resistance near 136.60, the 200-day EMA level near 136.75 can question the quote’s further advances.
Should GBP/JPY bulls keep the reins past-136.75, a 50% Fibonacci retracement level of 137.22 will appear on the market player’s radar.
Meanwhile, sellers targeting the September month’s low of 133.04 will take entries once the GBP/JPY prices decline below 61.8% Fibonacci retracement level of 135.93.
During declines between 135.93 and 133.04, 135.0 and 134.30 are likely stops that the bears may avail.
GBP/JPY daily chart
Trend: Further upside expected
Author

Anil Panchal
FXStreet
Anil Panchal has nearly 15 years of experience in tracking financial markets. With a keen interest in macroeconomics, Anil aptly tracks global news/updates and stays well-informed about the global financial moves and their implications.


