|

GBP/JPY Price Analysis: Bullish M-formaitons and 61.8% golden ratios eyed

  • GBP/JPY bulls stepping in to target a significant correction. 
  • Bulls eye the 61.8% Fibos across the time frames. 

GBP/JPY has left a weekly M-formation which is a bullish reversion pattern. If the price holds at this support area, then it would be expected to target the 61.8% Fibonacci where it meets the neckline lows of the formation.

GBP/JPY weekly chart

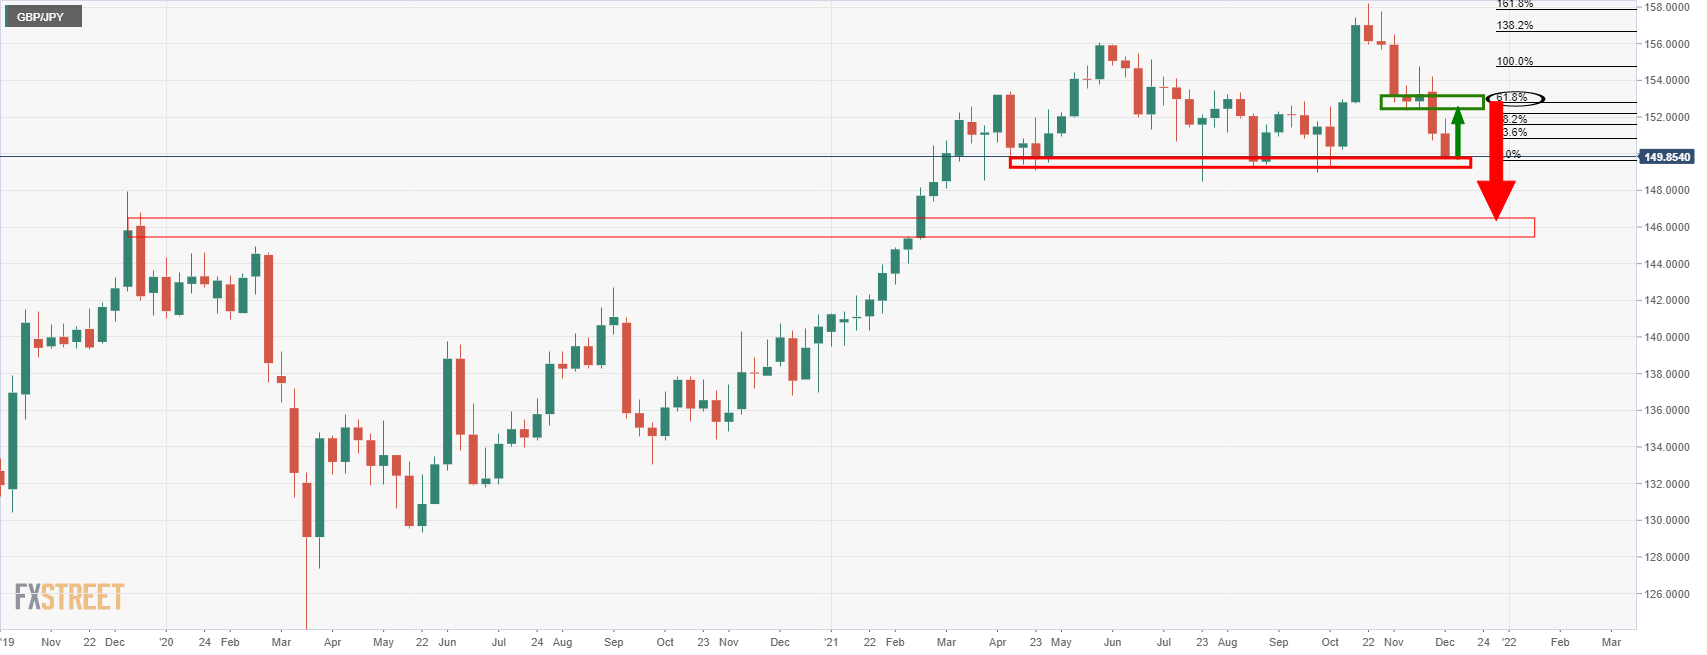
However, given the topping of the 2020 rally, should the neckline hold, then a downside continuation could be sparked for a run to 146.00.

GBP/JPY daily chart

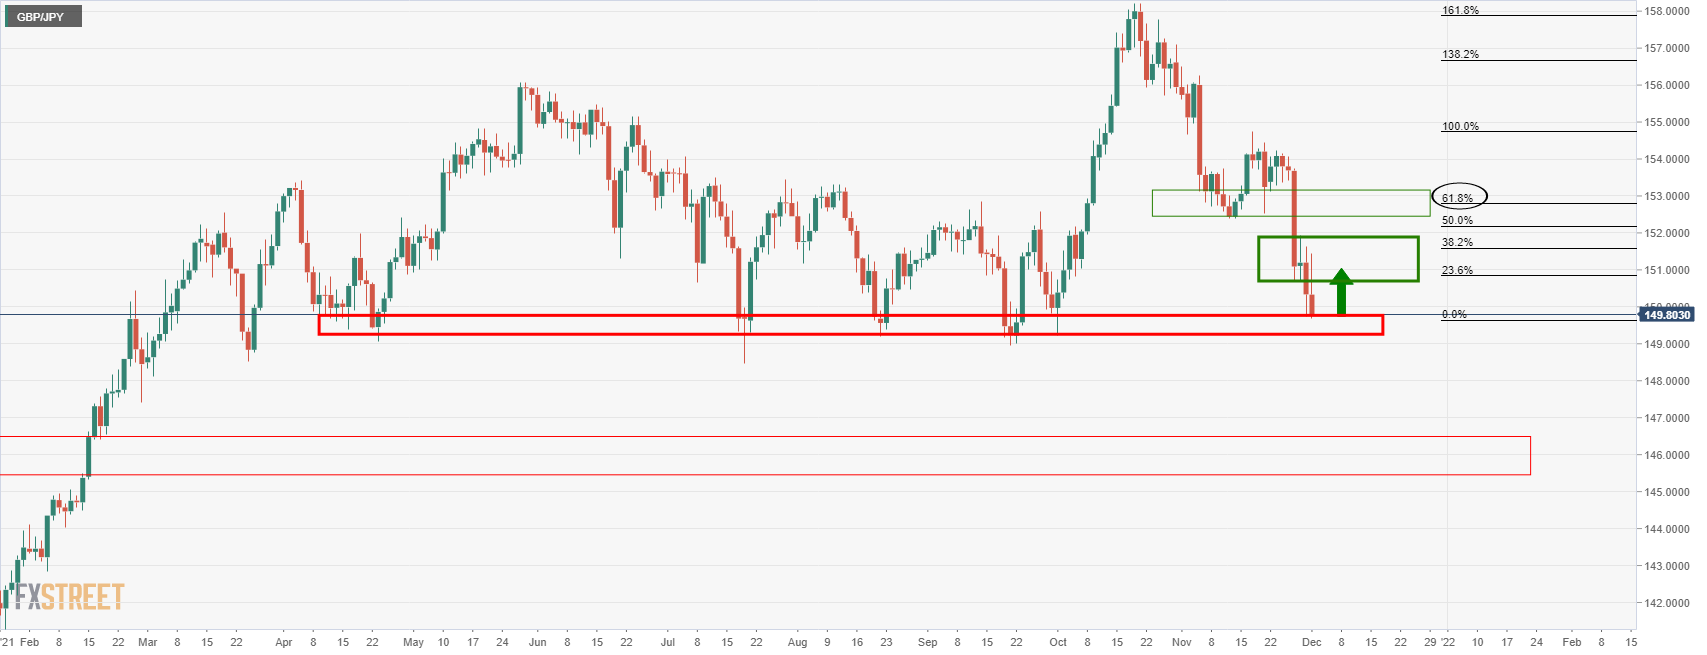
The daily chart shows that the price will first need to get beyond the order block between 150.69 and 151.91 first. 

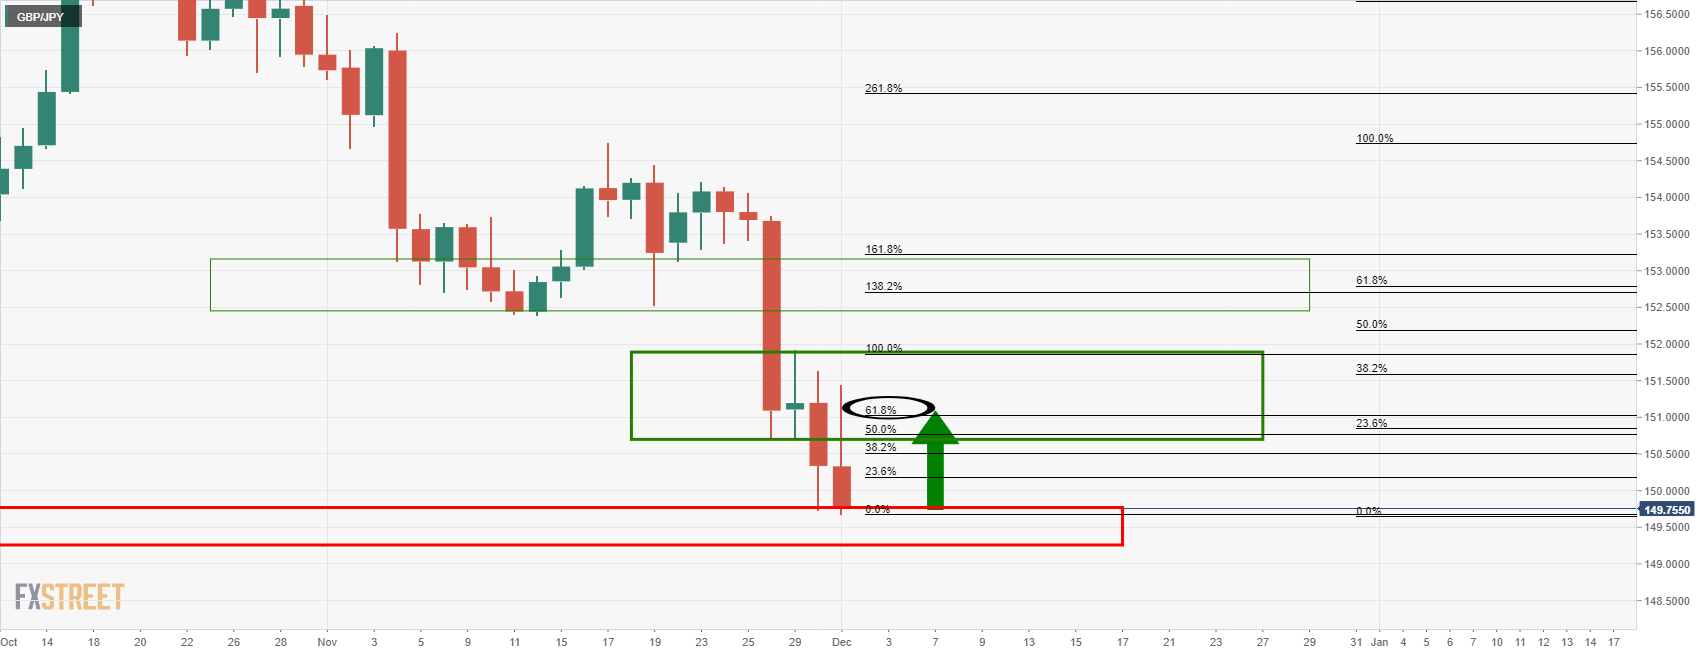
This puts the daily 61.8% ratio, located at 151.06 onto the radar following a break of the order block highs.
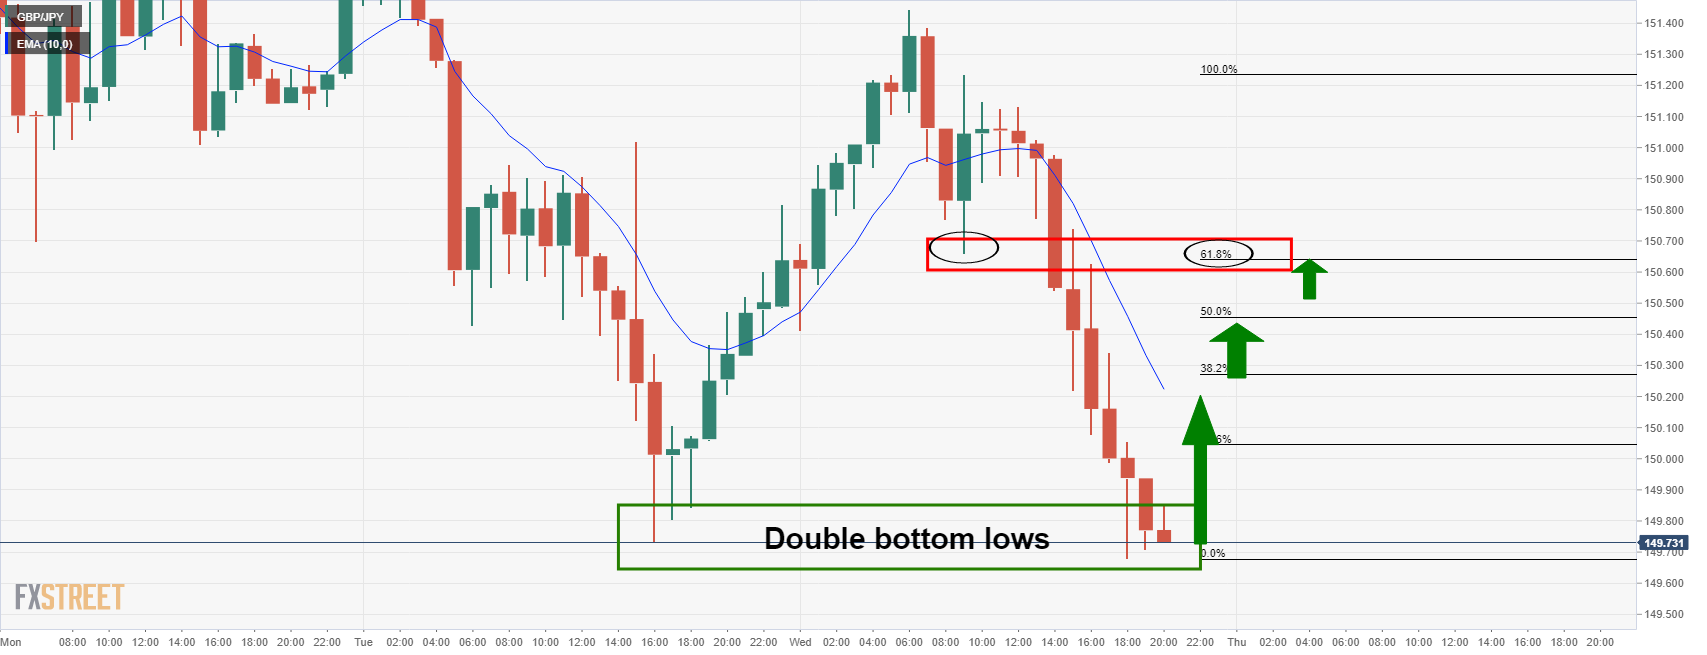
GBP/JPY H1 chart

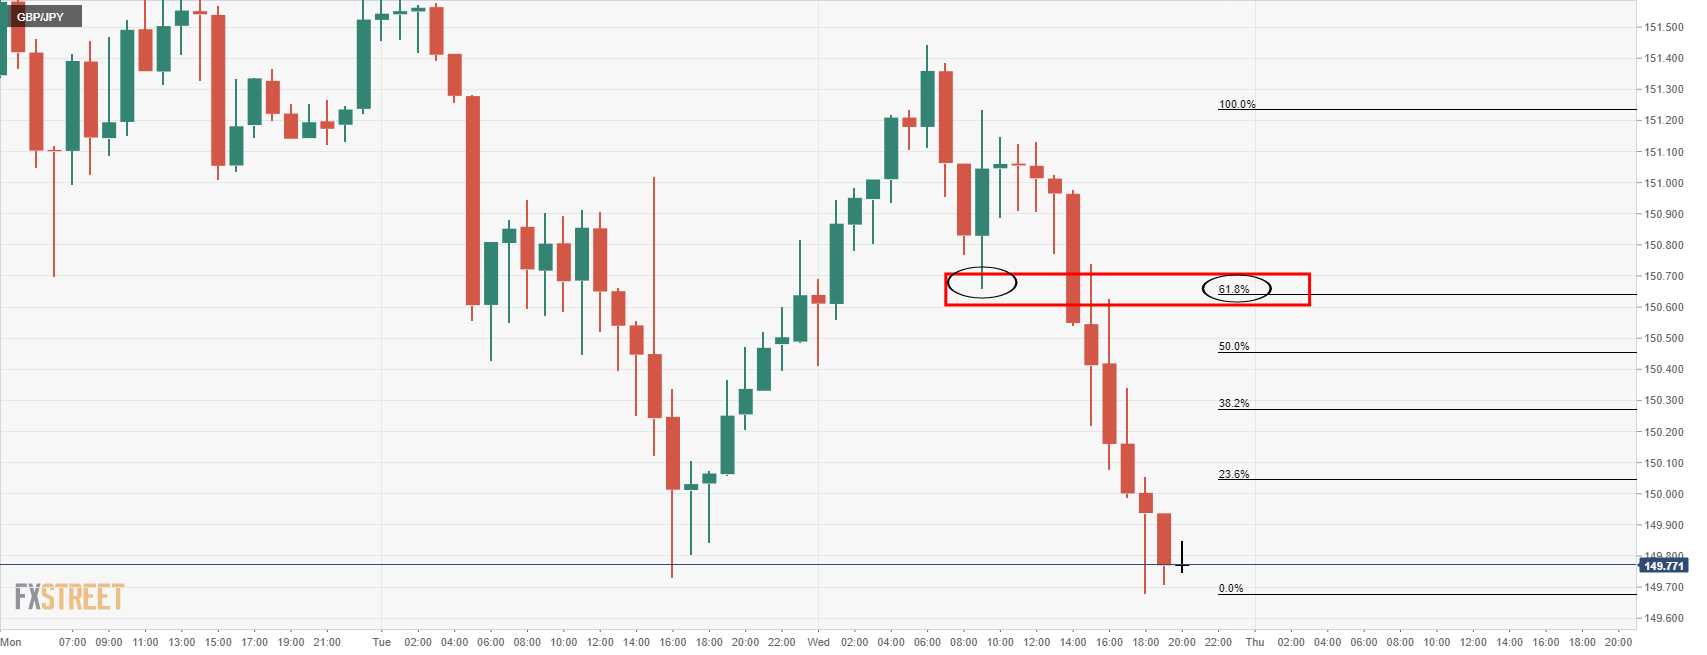
We are also seeing an M-formation on the hourly time frame. The neckline at 150.66 has a correlation with the 61.8% ratio also near the order block lows. This makes for a near term target of between 150.65/70 within the day's range of between 149.67/151.44 so far. 

However, there could be some stalling between the 38.2% Fib located at 150.27 and then the 10-hour EMA first. As the price rises, so too will the EMA and drift in near to a 50% retracement near 150.50. 

Author

Ross J Burland

Ross J Burland, born in England, UK, is a sportsman at heart. He played Rugby and Judo for his county, Kent and the South East of England Rugby team.

More from Ross J Burland
Share:

Editor's Picks

EUR/USD edges lower below 1.1650 as Middle East tensions fuel US Dollar strength

The EUR/USD pair trades in negative territory around 1.1635 during the early Asian session on Thursday. The US Dollar strengthens against the Euro as escalating Middle East conflict boosts safe-haven flows. Traders brace for the Eurozone Retail Sales and US weekly Initial Jobless Claims reports, which will be released later on Thursday. 

GBP/USD tests key moving averages as growth downgrade weighs

GBP/USD was nearly flat on Wednesday, edging up 0.08% to settle around 1.3370 in a quiet session. The pair has fallen sharply from its late-January high near 1.3870 and is now testing the 200-day Exponential Moving Average, with this week's one-week forex heatmap showing Pound Sterling as one of the worst performers against the US Dollar, down about 1.4% on the week.

Gold buyers stay hopeful amid Middle East war, China growth woes

Gold is building on the previous rebound in Thursday’s Asian trades, testing offers once again at the $5,200 threshold. Deeper escalation of the Middle East war and dovish US Federal Reserve monetary policy outlook continue to support Gold.

Trump presses Congress on CLARITY bill after meeting with Coinbase CEO

US President Donald Trump is urging legislators to pass the CLARITY Act after allegedly meeting with Coinbase CEO Brian Armstrong amid growing dispute over stablecoin yields.

First Venezuela, now Iran: The US-China energy war escalates

At first glance, the latest escalation involving the United States with both Iran and Venezuela looks like another chapter in a long-running geopolitical story. But viewed through a broader strategic lens, something else may be unfolding: Energy.

Bittensor extends recovery despite retail demand slump

Bittensor, a leading Artificial Intelligence token, is aging up above $190 at the time of writing on Wednesday. Steady price increases characterise the broader crypto market, with Bitcoin holding above $71,000 and Ethereum above $2,000.