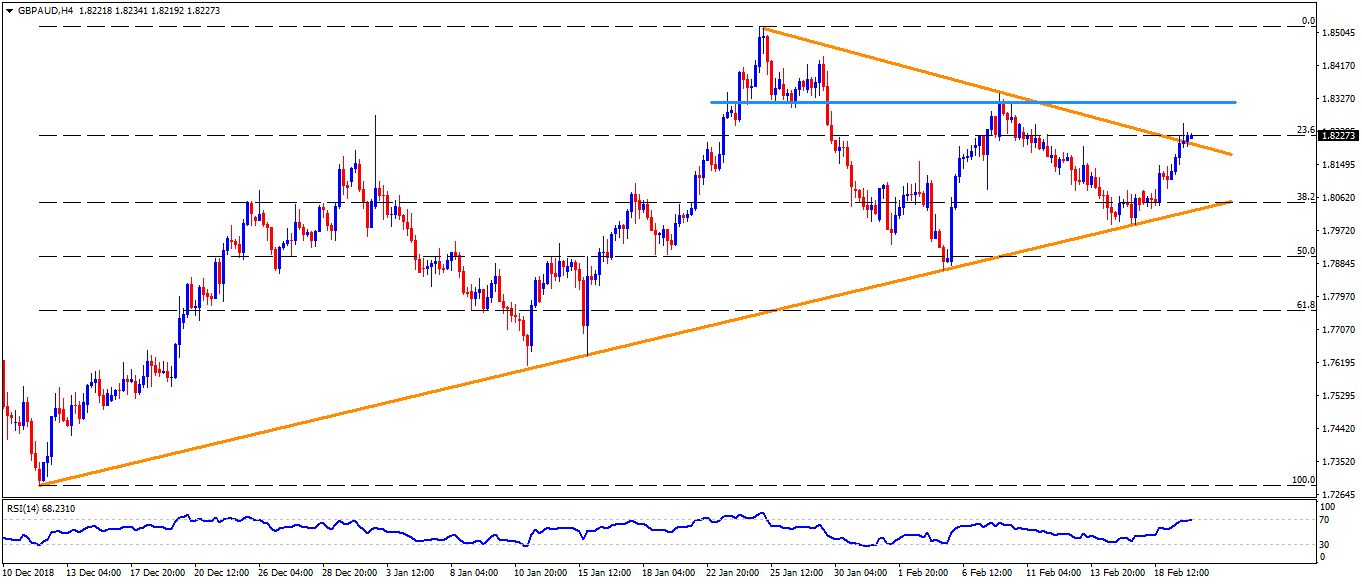
GBP/AUD Technical Analysis: Break of immediate resistance-line favors 1.8315 comeback
- GBP/AUD trades little changed around 1.8310 during initial Asian session on Wednesday.
- The pair recently crossed three-week old descending trend-line connecting highs marked since January 25.
- With the clear break of short-term resistance, the quote may accelerate its recovery to 1.8315 horizontal-line upside barrier.
- However, pair’s advance beyond 1.8315 can become difficult if overbought levels of 14-bar relative strength index (RSI) play its role, if not then 1.8440 and 1.8515 can reappear on the chart.
- Meanwhile, 1.8150 and 1.8080 can offer nearby support to the pair during its pullback ahead of highlighting an upward sloping trend-line at 1.8020, adjacent to 1.8000 round-figure.
- Given the pair’s decline under 1.8000, 50% Fibonacci retracement level of mid-December to late-January rise, at 1.7900, followed by 1.7820, can gain sellers’ attention.

GBP/AUD 4-Hour chart
Additional important levels:
Overview:
Today Last Price: 1.8227
Today Daily change: 4 pips
Today Daily change %: -0.02%
Today Daily Open: 1.8231
Trends:
Daily SMA20: 1.8173
Daily SMA50: 1.7996
Daily SMA100: 1.7987
Daily SMA200: 1.7891
Levels:
Previous Daily High: 1.8263
Previous Daily Low: 1.8078
Previous Weekly High: 1.8266
Previous Weekly Low: 1.7991
Previous Monthly High: 1.8796
Previous Monthly Low: 1.7612
Daily Fibonacci 38.2%: 1.8192
Daily Fibonacci 61.8%: 1.8149
Daily Pivot Point S1: 1.8118
Daily Pivot Point S2: 1.8006
Daily Pivot Point S3: 1.7933
Daily Pivot Point R1: 1.8303
Daily Pivot Point R2: 1.8376
Daily Pivot Point R3: 1.8488
Author

Anil Panchal
FXStreet
Anil Panchal has nearly 15 years of experience in tracking financial markets. With a keen interest in macroeconomics, Anil aptly tracks global news/updates and stays well-informed about the global financial moves and their implications.


