|

GBP/AUD Price Analysis: Bears in control and seek break of 4-hour support structure

  • GBP/AUD is brewing up a bearish opportunity as the stars align. 
  • The 4-hour chart, however, has a support structure to clear first. 

GBP/AUD has been in a weekly decline and is on the verge of a downside extension according to the weekly and daily charts. 

The following is a top-down analysis of the price action's trajectory all the way onto a 4-hour chart which illustrates where the next bearish opportunity could be derived.

Weekly chart

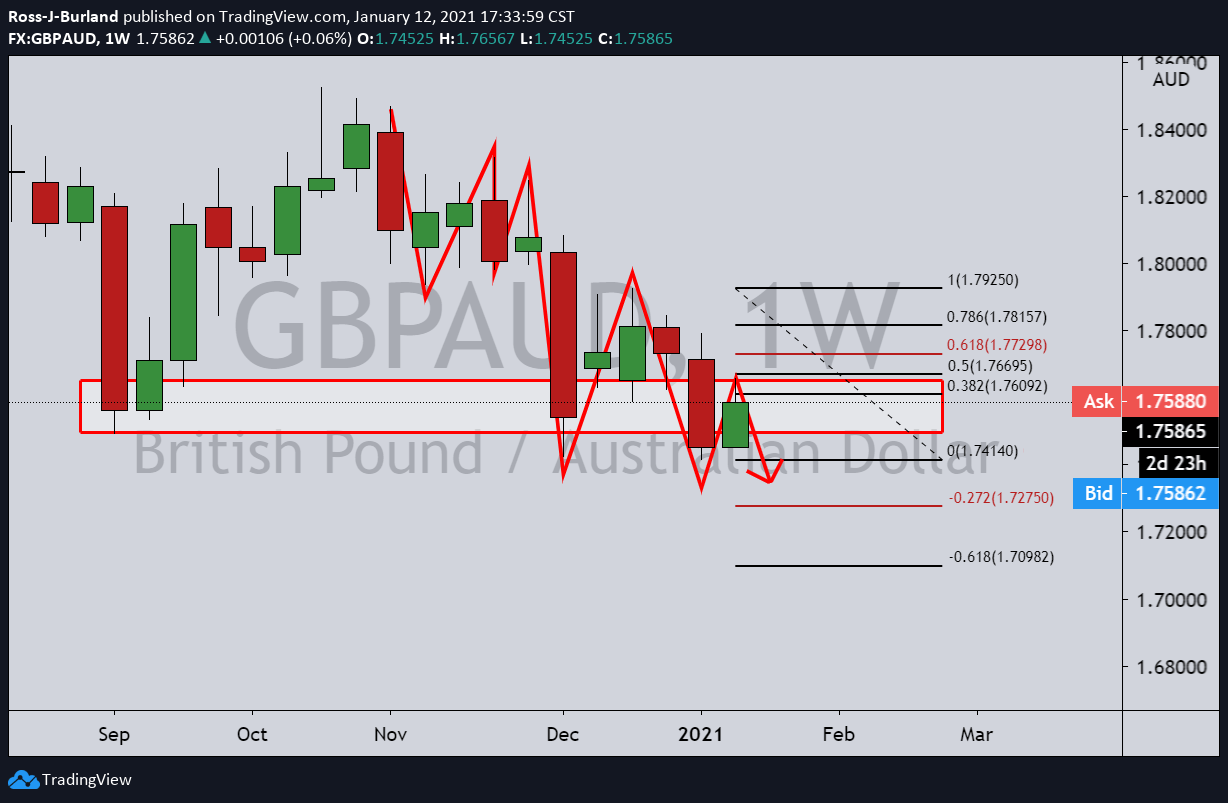
The weekly chart is bearish and price would be expected to continue to the downside following the restest of resistance. 

Daily chart

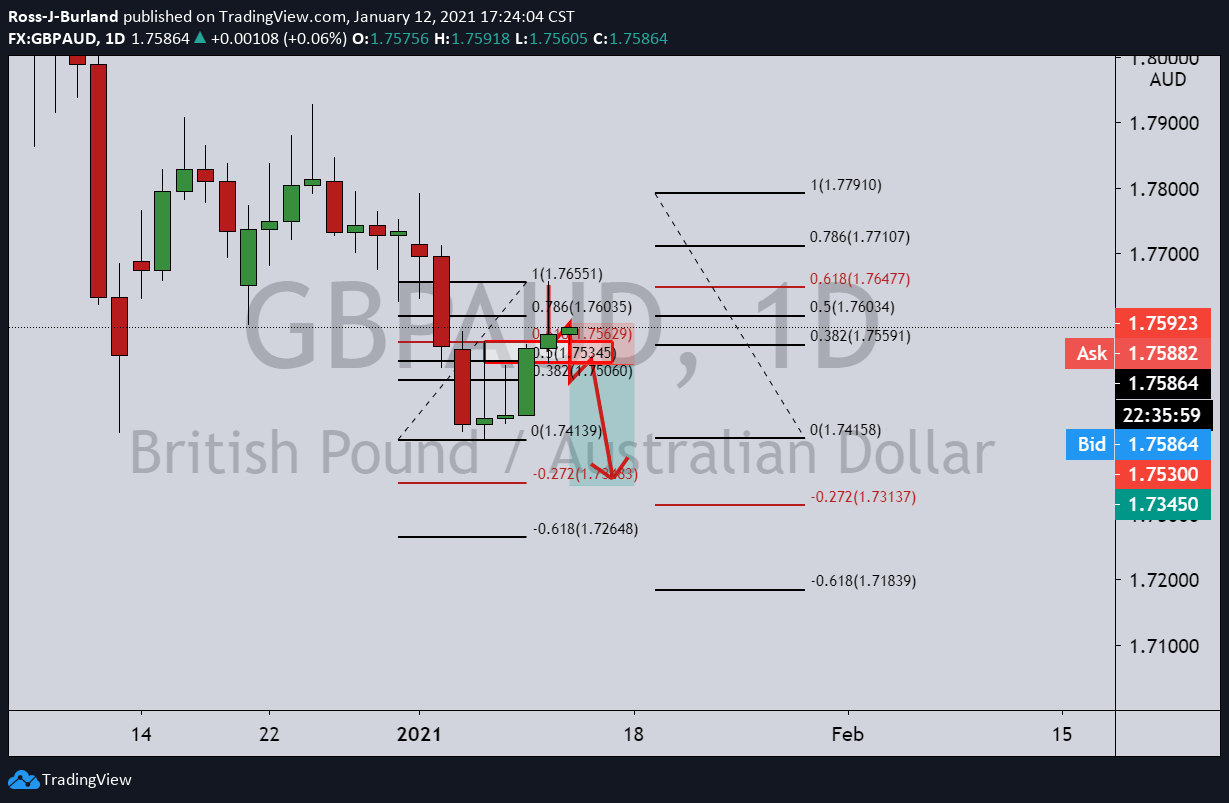
The market has retraced a significant portion of the bearish impulse and by as much as a 61.8% Fibonacci retracement. 

A downside opportunity in a bearish continuation would now be expected to present itself sometime soon on the 4-hour chart

4-hour chart

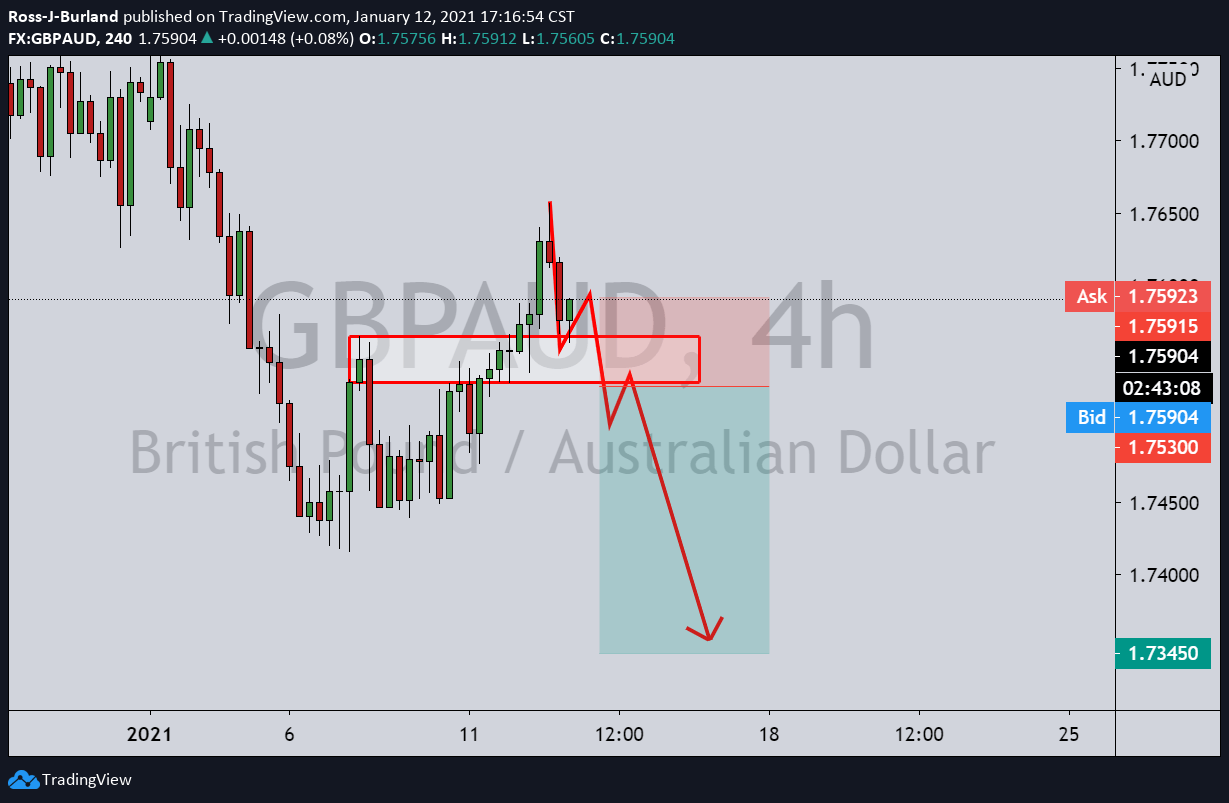
As illustrated, there is plenty of structure that the market needs to break to the downside before a convincing opportunity will reveal itself. 

Author

Ross J Burland

Ross J Burland, born in England, UK, is a sportsman at heart. He played Rugby and Judo for his county, Kent and the South East of England Rugby team.

More from Ross J Burland
Share:

Editor's Picks

EUR/USD looks apathetic around 1.1770

EUR/USD comes under renewed pressure on Tuesday, deflating below the 1.1800 support and reversing two consecutive days of gains. The pair’s decline follows the persistent move higher in the US Dollar, as trade uncertainty dominates the sentiment ahead of President Trump’s SOTU speech.

GBP/USD regains 1.3500 and above

GBP/USD extends its advance for the third day in a row on Tuesday, this time retesting the area beyond the 1.3500 hurdle. Cable’s uptick comes despite decent gains in the Greenback and the dovish message from the BoE’s Bailey at the UK Parliament.

Gold appears offered around $5,150

Gold is giving back a good portion of the recent multi-day rally, receding to the $5,150 zone per troy ounce amid the decent bounce in the US Dollar and mixed US Treasuty yields. In the meantime, markets’ attention remain on upcoming comments from Fed speakers.

Ripple’s DeFi shift in focus: Navigating XRPL EVM sidechain growth, XRPFi migration and liquidity

Ripple (XRP) has continued to trade under pressure, extending its decline by approximately 63% from the record high of $3.66 in July. The remittance token is trading above support at $1.35, while its upside appears limited by key supply zones, starting with $1.40, at the time of writing on Tuesday.

The Citrini report: How a debatable AI narrative can shake Wall Street

That AI-related headline alone was enough to rattle investors.US stocks slid sharply on Monday after a widely circulated Citrini Research memo outlined a hypothetical “2028 Global Intelligence Crisis”, warning that rapid AI adoption could push US unemployment into double digits as early as by mid-2028.

XRP pressured by weak ETF flows and declining retail interest

Ripple (XRP) is edging lower, trading above its intraday low of $1.32 at the time of writing on Tuesday. The decline from its weekly opening of $1.39 reflects heightened volatility in the broader cryptocurrency market, accentuated by tariff-triggered uncertainty.