|
Exxon Mobil Corp ($XOM) calling the zigzag higher

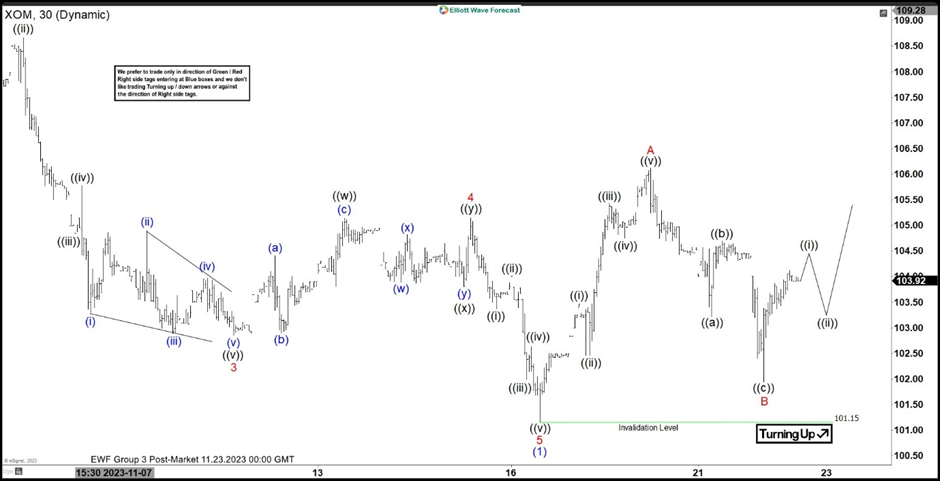
In today’s article, we will look at the past performance of the 1H Hour Elliott Wave chart of Exxon Mobil Corp ($XOM). The rally from 11.16.2023 low at $101.15 unfolded as a 5 wave impulse. So, we expected the pullback to unfold in 3 swings and find buyers again. We will explain the structure & forecast below:
$XOM 1H Elliott Wave chart 11.21.2023
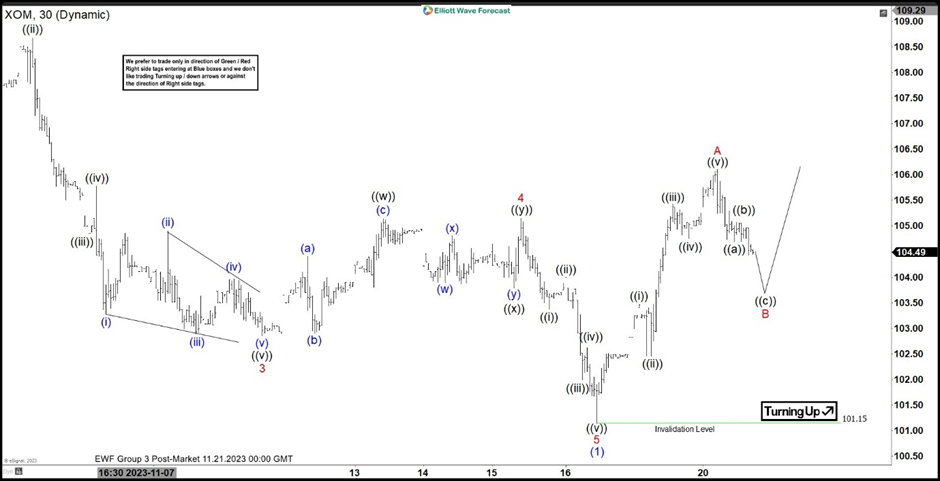
Here is the 1H Elliott Wave count from 11.21.2023. We were calling the pullback to find buyers at red B in 3 swings (ABC).
$XOM 1H Elliott Wave chart 11.19.2023
Author

Elliott Wave Forecast Team
ElliottWave-Forecast.com
More from Elliott Wave Forecast Team


