EUROSTOXX (SX5E) forecasting the rally after Elliott Wave double three

Hello fellow traders. In this technical article we’re going to take a look at the Elliott Wave charts charts of EUROSTOXX (SX5E) Index published in members area of the website. Our members know EUROSTOXX recently made a clear three-wave correction against the 4888.28 low . The pull back completed right within the Equal Legs zone. In this discussion, we’ll break down the Elliott Wave pattern and forecast.
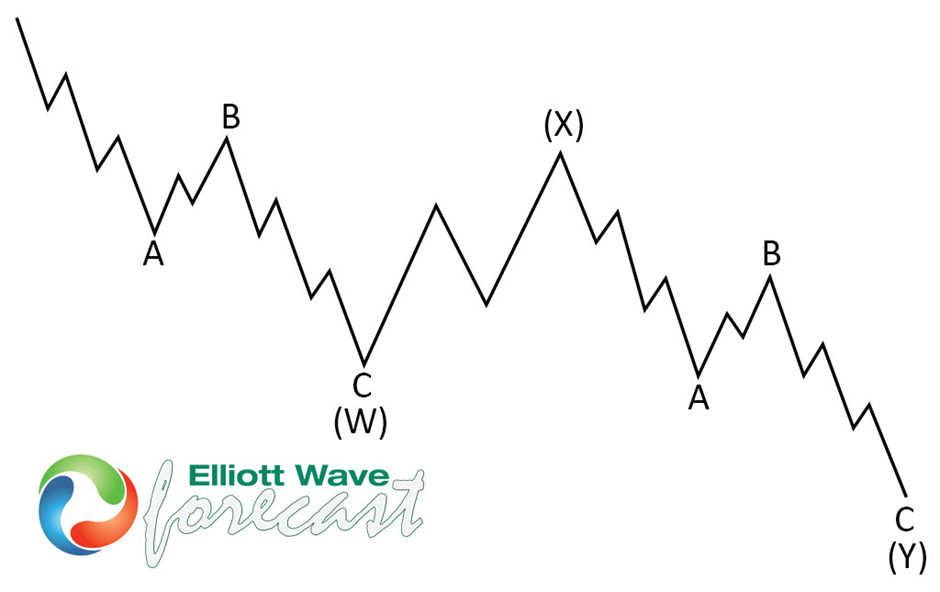
Elliott Wave double three pattern
Double three is the common pattern in the market , also known as 7 swing structure. It’s a reliable pattern which is giving us good trading entries with clearly defined invalidation levels.
The picture below presents what Elliott Wave Double Three pattern looks like. It has (W),(X),(Y) labeling and 3,3,3 inner structure, which means all of these 3 legs are corrective sequences. Each (W) and (Y) are made of 3 swings , they’re having A,B,C structure in lower degree, or alternatively they can have W,X,Y labeling.
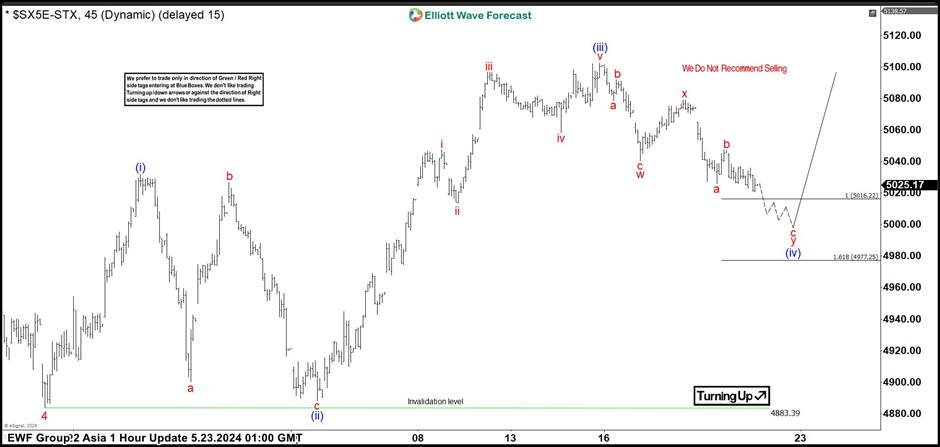
EUROSTOXX Elliott Wave one-hour chart 05.23.2024
EUROSTOXX is showing impulsive bullish sequences in the cycle from the 4883.39 low, suggesting further strength ahead. Presently, the index is undergoing an intraday pullback (iv) in blue. The structure of this pullback remains incomplete, indicating short-term weakness towards the 5016.22-4977.25 (buyers area). The first leg, shows a clear 3-wave structure a,b,c red, followed by a 3-wave bounce. We anticipate the pullback to form a Double Three pattern, projecting 3 waves in y leg as well. We advise against selling $SX5E and instead favor the long side from the marked equal legs area. Once $SX5E reaches buying area, it should ideally either rally towards new highs or undergo a bounce in three waves alternatively.
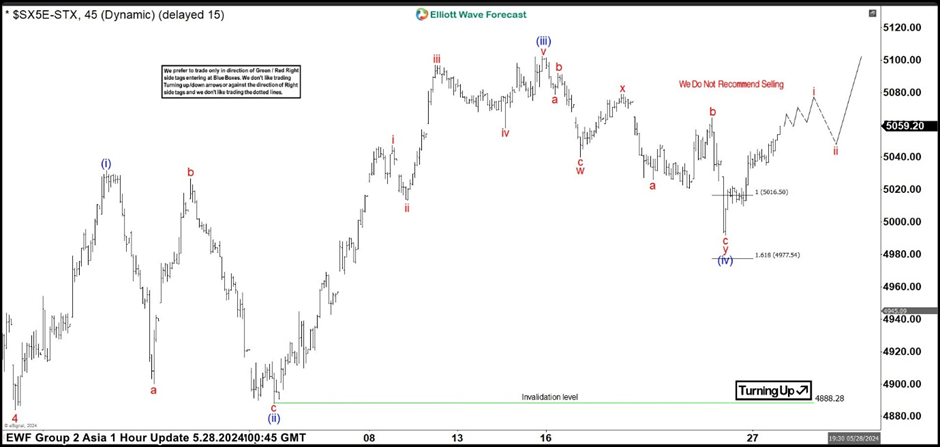
EUROSTOXX Elliott Wave one-hour chart 05.23.2024
EUROSTOXX hit our target zone at the 5016.22-4977.25 area and found buyers as expected. The index has reacted strongly from the Equal Legs Area. As far as the price stays above 4992.3 low, we can count (iv) completed there. We would like to see break of (iii) blue peak to confirm next leg up is in progress, targeting 5128-5171 area.
Keep in mind that market is dynamic and presented view could have changed in the mean time.
Author

Elliott Wave Forecast Team
ElliottWave-Forecast.com


