Dow Jones Industrial Average slides as Iran tensions, Walmart guidance and hawkish Fed weigh
- The Dow Jones shed nearly 300 points on Thursday as rising Crude Oil prices and cautious corporate guidance rattled investors.
- Walmart beat fourth-quarter estimates but disappointed with a full-year earnings outlook well below Wall Street expectations.
- Blue Owl Capital plunged over 8% after restricting investor redemptions, dragging the broader asset management sector lower.
- Initial Jobless Claims fell sharply to 206K, reinforcing the case for the Fed to stay on hold.

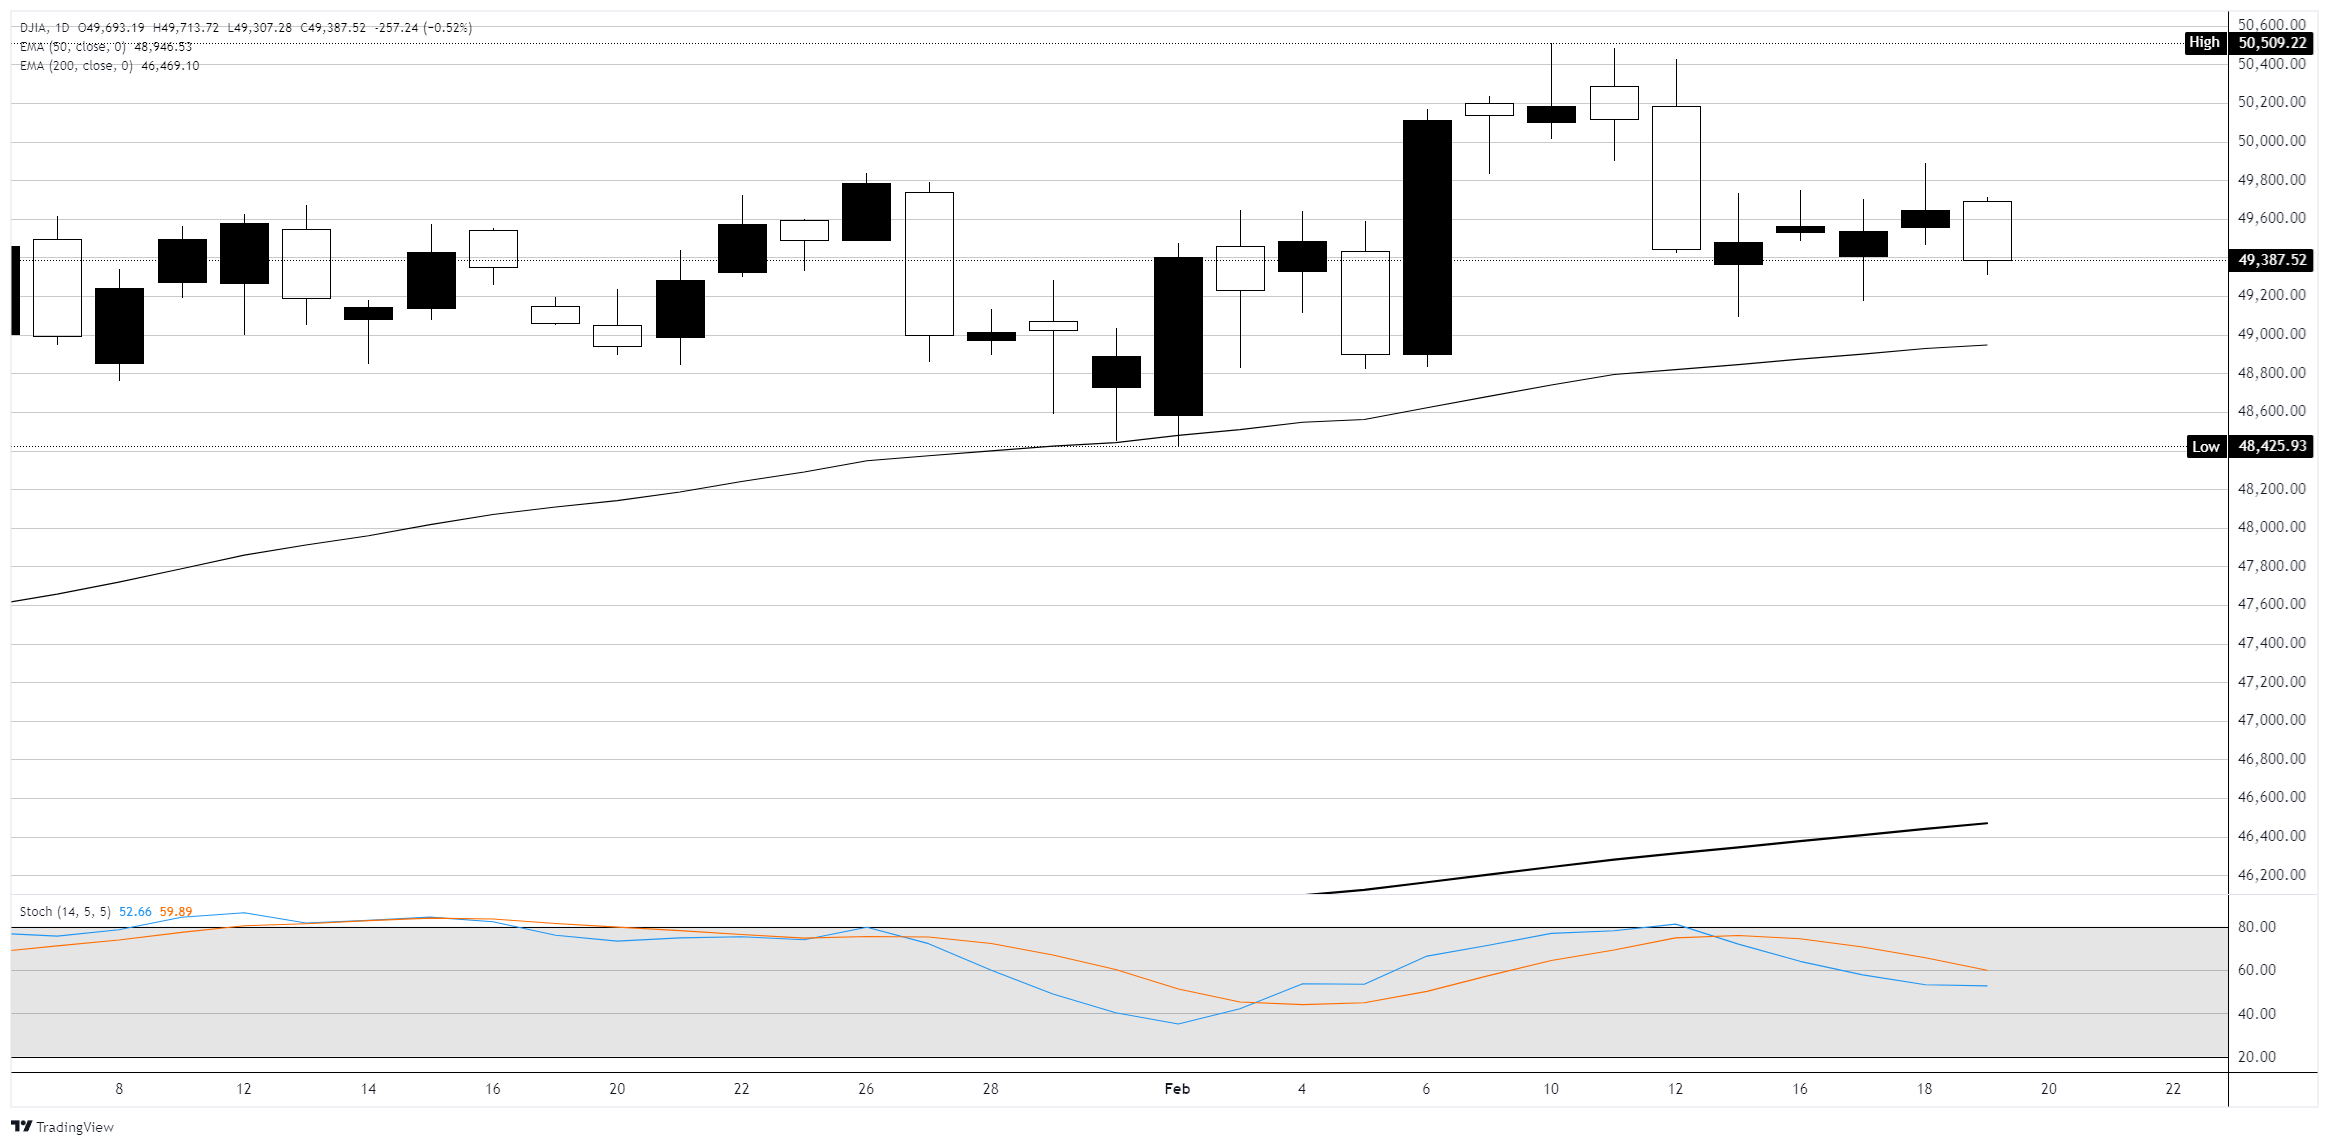
The Dow Jones Industrial Average (DJIA) slid nearly 300 points, or 0.59%, pulling back to 49,351 on Thursday as a confluence of geopolitical risk, hawkish Federal Reserve (Fed) signaling, and disappointing corporate guidance weighed on sentiment. The S&P 500 (SP500) fell 0.3% while the Nasdaq Composite dipped 0.2%. Thursday's losses gave back a chunk of Wednesday's gains, which had been driven by a broad rally in Magnificent Seven tech names and strength in financials and energy. The DJIA is holding well above its 50-day Exponential Moving Average (EMA) near 48,944, but is pulling further away from record highs above 50,500 set earlier this month.
Hawkish Fed minutes and strong labor data complicate rate outlook
Wednesday's Federal Open Market Committee (FOMC) minutes from the January 27-28 meeting revealed a surprisingly hawkish tone, with several policymakers floating the possibility that interest rates may need to rise if inflation remains stubbornly above the 2% target. The minutes showed "almost all" participants backed the decision to hold rates steady at 3.50%-3.75%, with Governors Stephen Miran and Christopher Waller the lone dissenters who voted for a 25-basis-point cut. Adding fuel to the higher-for-longer narrative, Thursday's Initial Jobless Claims data came in at 206K for the week ending February 14, plunging 23K from the prior week and well below the 225K consensus. It was the largest single-week drop since November. Continuing claims ticked up to 1.869 million. The CME FedWatch Tool continues to show roughly a 94% probability that the Fed will hold rates steady at the March 18 meeting, with the first fully priced-in rate cut not expected until mid-2026.
Looking ahead, Friday brings a major "data dump" as the Bureau of Economic Analysis (BEA) simultaneously releases the advance estimate for fourth-quarter 2025 Gross Domestic Product (GDP) and the December Personal Consumption Expenditures Price Index (PCE), the Fed's preferred inflation gauge. Both releases were delayed by the government shutdown and are arriving together. Consensus has Q4 GDP at an annualized 2.8%, cooling from 4.4% in Q3, while Goldman Sachs has flagged a potentially hot core PCE reading near 3.05% due to IT hardware cost pressures. Also on Friday, S&P Global will publish its flash February Purchasing Managers Index (PMI) readings for both manufacturing and services. The January manufacturing PMI came in at 52.4, indicating modest expansion, so markets will be watching for any demand softening or further tariff-related input cost pressures.
Walmart beats on revenue, but guidance falls flat
Walmart Inc. (WMT) reported fourth-quarter adjusted earnings per share (EPS) of $0.74 on revenue of $190.7 billion, topping estimates on both lines. US comparable sales rose 4.6% excluding fuel and global e-commerce surged 24%. However, the stock slipped roughly 2% after the retailer guided full-year EPS to $2.75-$2.85, well below the $2.96 Wall Street was expecting. Chief Financial Officer John David Rainey cited tariff uncertainty and moderating inflation as reasons for the cautious outlook. The company also announced a $30 billion share buyback program, its largest ever. This was the first quarterly report under new CEO John Furner, who took over from Doug McMillon on February 1.
Blue Owl drags asset managers lower on liquidity concerns
Blue Owl Capital Inc. (OWL) plunged over 8% after the alternative asset manager announced it was permanently restricting quarterly investor redemptions in its retail-focused OBDC II private credit fund, replacing them with periodic return-of-capital distributions. The move came alongside a $1.4 billion loan sale from three of Blue Owl's business development companies at 99.7% of par value. The liquidity crackdown spooked the broader alternative asset management space: Blackstone Inc. (BX) dropped around 6%, and Apollo Global Management Inc. (APO) fell roughly 5%. The selloff underscores ongoing concerns about liquidity mismatches in private credit vehicles that have been aggressively marketed to retail investors.
Software stocks stay under pressure as AI disruption fears linger
The software sector continued its brutal 2026 slide on Thursday. Salesforce Inc. (CRM) shed more than 1%, Intuit Inc. (INTU) fell 2%, and Cadence Design Systems Inc. (CDNS) dropped 3%. The sector has been a persistent sore spot this year as investors fear that artificial intelligence agents will displace traditional per-seat software licensing models. Names like Salesforce, Adobe, and ServiceNow are down 25-30% year-to-date. The pressure intensified after Mistral AI CEO Arthur Mensch told CNBC on Wednesday that more than 50% of enterprise software could be replaced by AI.
Crude Oil surges on Iran standoff, Gold reclaims $5K
Crude Oil extended its rally on Thursday, with West Texas Intermediate (WTI) futures climbing roughly 2% to above $66 per barrel and Brent crude reaching $71.49, their highest levels in nearly seven months. The surge followed reports of an escalating standoff between the US and Iran over Tehran's nuclear program, with US military action reportedly possible as early as this weekend. Iran's partial closure of the Strait of Hormuz for naval exercises added to supply disruption fears, given the chokepoint handles roughly 20% of global Oil consumption. Gold reclaimed the $5,000 per ounce level on safe-haven demand, with spot prices jumping to around $5,012. The geopolitical risk premium in energy markets poses a direct inflation headwind that could further complicate the Fed's rate path heading into Friday's PCE release.
Deere soars on earnings beat and raised outlook
Deere & Company (DE) surged over 7% after reporting first-quarter net sales of $9.61 billion, up 13% year-over-year, with EPS of $2.42 handily beating the $2.02-$2.11 consensus range. The farm equipment giant raised its full-year net income forecast to $4.5-$5.0 billion, up from the prior $4.0-$4.75 billion guidance, citing improving demand in construction and small agriculture. CEO John May said the company believes 2026 represents the trough of the current agricultural cycle, positioning Deere for accelerated growth ahead.
Dow Jones daily chart
Dow Jones FAQs
The Dow Jones Industrial Average, one of the oldest stock market indices in the world, is compiled of the 30 most traded stocks in the US. The index is price-weighted rather than weighted by capitalization. It is calculated by summing the prices of the constituent stocks and dividing them by a factor, currently 0.152. The index was founded by Charles Dow, who also founded the Wall Street Journal. In later years it has been criticized for not being broadly representative enough because it only tracks 30 conglomerates, unlike broader indices such as the S&P 500.
Many different factors drive the Dow Jones Industrial Average (DJIA). The aggregate performance of the component companies revealed in quarterly company earnings reports is the main one. US and global macroeconomic data also contributes as it impacts on investor sentiment. The level of interest rates, set by the Federal Reserve (Fed), also influences the DJIA as it affects the cost of credit, on which many corporations are heavily reliant. Therefore, inflation can be a major driver as well as other metrics which impact the Fed decisions.
Dow Theory is a method for identifying the primary trend of the stock market developed by Charles Dow. A key step is to compare the direction of the Dow Jones Industrial Average (DJIA) and the Dow Jones Transportation Average (DJTA) and only follow trends where both are moving in the same direction. Volume is a confirmatory criteria. The theory uses elements of peak and trough analysis. Dow’s theory posits three trend phases: accumulation, when smart money starts buying or selling; public participation, when the wider public joins in; and distribution, when the smart money exits.
There are a number of ways to trade the DJIA. One is to use ETFs which allow investors to trade the DJIA as a single security, rather than having to buy shares in all 30 constituent companies. A leading example is the SPDR Dow Jones Industrial Average ETF (DIA). DJIA futures contracts enable traders to speculate on the future value of the index and Options provide the right, but not the obligation, to buy or sell the index at a predetermined price in the future. Mutual funds enable investors to buy a share of a diversified portfolio of DJIA stocks thus providing exposure to the overall index.
Author

Joshua Gibson
FXStreet
Joshua joins the FXStreet team as an Economics and Finance double major from Vancouver Island University with twelve years' experience as an independent trader focusing on technical analysis.