|

EUR/USD Technical Analysis: Rising odds for a test of YTD lows around 1.1290

  • EUR/USD remains on the defensive, intensifying the bearish sentiment following the recent breakdown of the critical 200-week SMA in the 1.1330 region.
  • Further losses should meet strong support in the 1.1289/69 band in the near term, where coincide YTD lows and December 2018 lows. This area is expected to hold the downside.
  • On the other hand, a surpass of the key 100-day SMA at 1.1424 should mitigate the downside pressure.

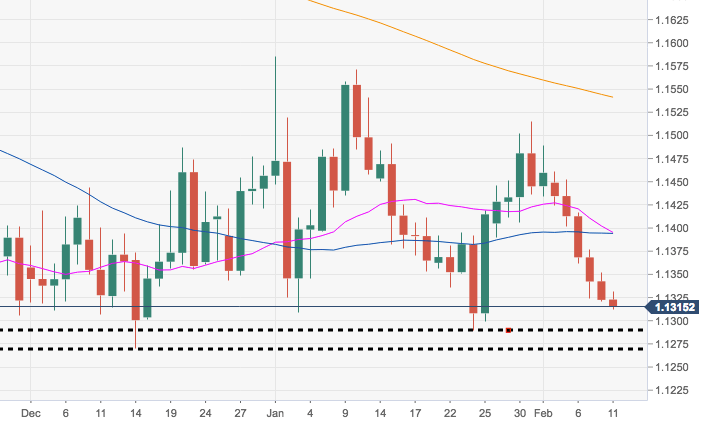
EUR/USD daily chart

EUR/USD

Overview:
    Today Last Price: 1.1318
    Today Daily change: 20 pips
    Today Daily change %: -0.04%
    Today Daily Open: 1.1322
Trends:
    Daily SMA20: 1.1399
    Daily SMA50: 1.14
    Daily SMA100: 1.1425
    Daily SMA200: 1.1544
Levels:
    Previous Daily High: 1.1353
    Previous Daily Low: 1.132
    Previous Weekly High: 1.1462
    Previous Weekly Low: 1.132
    Previous Monthly High: 1.1586
    Previous Monthly Low: 1.1289
    Daily Fibonacci 38.2%: 1.1333
    Daily Fibonacci 61.8%: 1.134
    Daily Pivot Point S1: 1.1311
    Daily Pivot Point S2: 1.13
    Daily Pivot Point S3: 1.1279
    Daily Pivot Point R1: 1.1343
    Daily Pivot Point R2: 1.1364
    Daily Pivot Point R3: 1.1375

Author

Pablo Piovano

Born and bred in Argentina, Pablo has been carrying on with his passion for FX markets and trading since his first college years.


More from Pablo Piovano
Share:

Editor's Picks

GBP/USD weakens to two-week lows near 1.3520

GBP/USD trades on the back foot, returning to the low 1.3500s, or two-week troughs, on Tuesday. Cable’s bearish price action follows decent gains in the Greenback at the time when investors assess latest US data releases and the persistent uncertainty in the US-Iran crisis.

EUR/USD remains offered; breaks below 1.1600

EUR/USD now accelerates its daily correction, breaching below the key 1.1600 support level on Tuesday. The pair’s daily correction comes on the back of a decent bounce in the US Dollar despite disappointing US data releases and amid persistent geopolitical concerns.

Gold flirts with multi-week lows near $4,300

Gold accelerates its correction and recedes toward the key $4,300 mark per troy ounce on Tuesday. The yellow metal’s persistent decline comes in response to the solid performance of the US Dollar and a sharp move higher in US Treasury yields across the curve.

Bitcoin and Gold Outlook: Bitcoin broadly consolidates, Gold falls as US JOLTS Job Openings rise
Bitcoin (BTC) maintains sideways trading around the immediate $78,000 support on Tuesday. The Crypto King outlook shows signs of cooling after the recent rally above $81,000. However, its downside remains protected, with major moving averages providing support and steady capital inflows absorbing some selling pressure.
Global bond market sell off haunts markets

Global sovereign bonds are selling off as we start a new month. The UK is, unsurprisingly, taking the biggest hit. Two and 10-year yields rose by 10 basis points at one point on Tuesday, and are currently higher by 7 and 8bps respectively.

Diesel’s record $100 warning: The oil shock hiding in plain sight

The Oil market may look calmer than it did a few months ago, but diesel is sending a very different message. The US diesel crack spread, the premium of ultra-low sulphur diesel futures over WTI, recently surged above $100 per barrel for the first time, reaching an intraday record of just over $102.00.