|

EUR/USD Technical Analysis: Rising bets for another test of 2019 lows near 1.1100

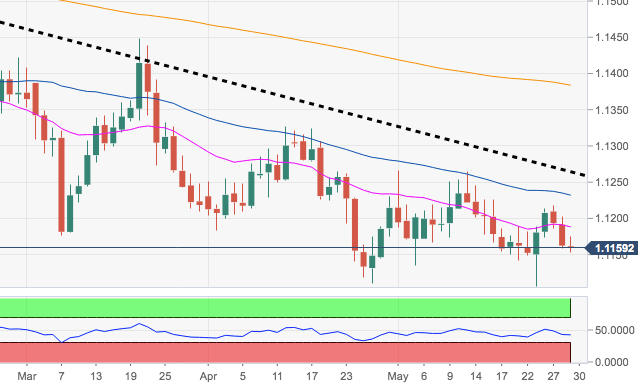
  • The pair stays on the defensive so far this week, eroding further the rebound seen during the second half of last week to the 1.1200 handle and beyond.
  • Immediately to the upside emerges the next target at recent peaks near 1.1220. This hurdle is reinforced by the Fibo retracement of the 2019 drop at 1.1216.
  • Further out, the negative view on EUR/USD remains unchanged while below the multi-month resistance line, today at 1.1264.

EUR/USD daily chart

EUR/USD

Overview
Today last price1.1155
Today Daily Change20
Today Daily Change %-0.06
Today daily open1.1162
 
Trends
Daily SMA201.119
Daily SMA501.1226
Daily SMA1001.1293
Daily SMA2001.1386
Levels
Previous Daily High1.1202
Previous Daily Low1.1159
Previous Weekly High1.1214
Previous Weekly Low1.1107
Previous Monthly High1.1326
Previous Monthly Low1.1111
Daily Fibonacci 38.2%1.1176
Daily Fibonacci 61.8%1.1186
Daily Pivot Point S11.1147
Daily Pivot Point S21.1131
Daily Pivot Point S31.1103
Daily Pivot Point R11.119
Daily Pivot Point R21.1218
Daily Pivot Point R31.1234

Author

Pablo Piovano

Born and bred in Argentina, Pablo has been carrying on with his passion for FX markets and trading since his first college years.

More from Pablo Piovano
Share:

Editor's Picks

EUR/USD: Cautiously optimistic near 1.1550 ahead of the ECB

EUR/USD extends its weekly recovery for the third day in a row on Wednesday, navigating in a sidelined fashion around 1.1550 on the back of humble losses in the US Dollar. In the meantime, market participants continue to closely follow developments in the Middle East while slowly gearing up for the ECB gathering on Thursday.

GBP/USD recedes from tops, hovers around 1.3400

GBP/USD could not sustain the initial bull run and is now slipping back toward the 1.3400 neighbourhood on Wednesday. Cable’s continuation of the ongoing leg higher follows mild selling pressure on the Greenback, despite steady uncertainty on the geopolitical front and elevated US inflation.

Gold bleeding continues as Middle East crisis escalates, Fed hike coming

Gold is accelerating its downward trends and approaches the area of $4,100 per troy ounce on Wednesday, where the 2026 bottom sits so far. The persistent decline in the precious metal almost exclusively follows the swelling opinion that the Fed will keep a cautious stance in H2, a view that was reinforced following earlier US CPI data.

Ethereum: Network activity remains elevated despite recent declines
Ethereum Active Addresses have maintained a downtrend since declining from peak levels in early February. The 14-day moving average of the metric shows that unique on-chain participation has been contracting MoM since the sharp decline in February.
From sizzle to fizzle: Tech sinks as Oil puts the Fed tail back on the table
Wall Street was not hit by one punch. It was caught between three swinging doors at the same time: a renewed technology unwind, a fresh geopolitical oil bid, and a wave of equity supply that is starting to look less like capital formation and more like a liquidity test for the entire AI complex.
The US economy defies the rules: 100 days into the Oil shock and the recession signal is still missing

More than three months after the start of the Iran war and the resulting disruption to global energy markets, the US economy continues to display remarkable resilience. The conflict has triggered a sharp rise in Oil prices, reignited inflationary pressures and fueled widespread concerns about a potential economic slowdown.

EUR/USD Technical Analysis: Rising bets for another test of 2019 lows near 1.1100