|

EUR/USD slow movement explained, but it can change below 1.0960 – Confluence Detector

EUR/USD is moving ever so slowly to the downside and this may be frustrating many traders, but can be explained by the density of technical levels. However, the currency pair is leaning lower and may lose support.

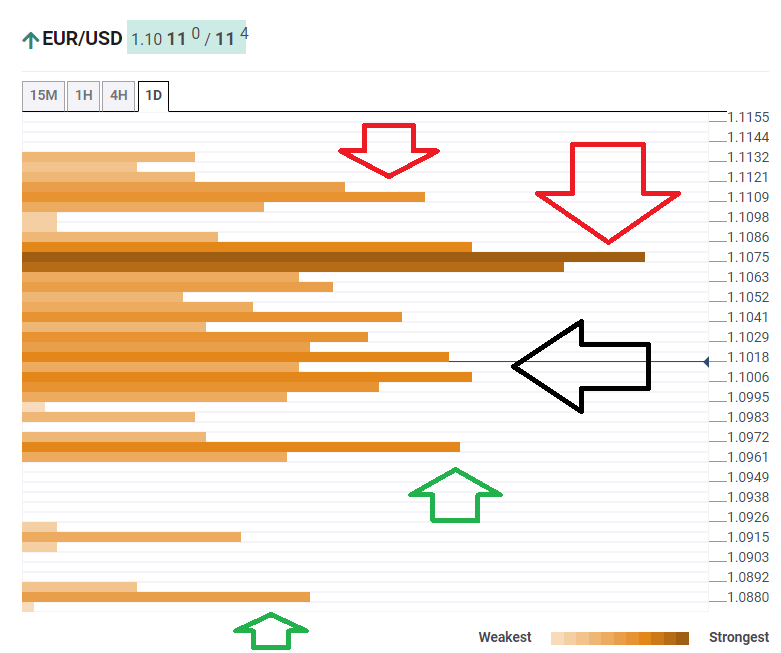
The Technical Confluences Indicator is showing that euro/dollar is mired in a dense cluster of lines extending from 1.1006 to 1.1018 and also a tad higher. The area that limits price action includes the Simple Moving Average 10-1h, the Bollinger Band 15min-Middle, the SMA 5-15m, the SMA 5-1h, the BB 1h-Middle, the Fibonacci 38.2% one-day, the previous daily low, the BB 1h-Lower, the BB one-day Lower, and many more.

Lower, support awaits at 1.0960, which is the convergence of the Pivot Point one-month Support 1 and the PP one-day S3. 

Further down, the downside target is 1.0879, which is the one-month low. 

Looking up, fierce resistance awaits at 1.1075, where the PP one-day R3 and the Fibonacci 38.2% one-month among others. 

Higher, 1.1109 is the confluence of the SMA 100 one-day and the Fibonacci 23.6% one-month.

Here is how it looks on the tool:

EUR USD confluence analysis November 13 2019

Confluence Detector

The Confluence Detector finds exciting opportunities using Technical Confluences. The TC is a tool to locate and point out those price levels where there is a congestion of indicators, moving averages, Fibonacci levels, Pivot Points, etc. Knowing where these congestion points are located is very useful for the trader, and can be used as a basis for different strategies.

This tool assigns a certain amount of “weight” to each indicator, and this “weight” can influence adjacents price levels. These weightings mean that one price level without any indicator or moving average but under the influence of two “strongly weighted” levels accumulate more resistance than their neighbors. In these cases, the tool signals resistance in apparently empty areas.

Learn more about Technical Confluence

Author

Yohay Elam

Yohay Elam

FXStreet

Yohay is in Forex since 2008 when he founded Forex Crunch, a blog crafted in his free time that turned into a fully-fledged currency website later sold to Finixio.

More from Yohay Elam
Share:

Editor's Picks

EUR/USD holds losses near 1.1850 as US, China holidays keep trade muted

EUR/USD opens the week on a softer note, trading near 1.1860 during the Asian session on Monday. Activity is likely to remain muted, with United States markets closed for the Presidents’ Day holiday, while Mainland China is also shut for the week-long Lunar New Year break.

GBP/USD flat lines as traders await key UK macro data and FOMC minutes

The GBP/USD pair kicks off a new week on a subdued note and oscillates in a narrow range, just below mid-1.3600s, during the Asian session. Moreover, the mixed fundamental backdrop warrants some caution for aggressive traders as the market focus now shifts to this week's important releases from the UK and the US.

Gold remains below $5,050 despite Fed rate cut bets, uncertain geopolitical tensions

Gold edges lower after registering over 2% gains in the previous session, trading around $5,030 per troy ounce during the Asian hours on Monday. However, the non-interest-bearing Gold could further gain ground following softer January Consumer Price Index figures, which reinforced expectations that the Federal Reserve could cut rates later this year.

Top Crypto Losers: Dogecoin, Zcash, Bonk – Meme and Privacy coins under pressure

Meme coins such as Dogecoin and Bonk, alongside the privacy coin Zcash (ZEC), are leading the broader market losses over the last 24 hours. DOGE, ZEC, and BONK ended their three consecutive days of recovery with a sudden decline on Sunday, as crucial resistance levels capped the gains. Technically, the altcoins show downside risk, starting the week under pressure.

Global inflation watch: Signs of cooling services inflation

Realized inflation landed close to expectations in January, as negative base effects weighed on the annual rates. Remaining sticky inflation is largely explained by services, while tariff-driven goods inflation remains limited even in the US.

Ripple Price Forecast: XRP potential bottom could be in sight

Ripple edges up above the intraday low of $1.35 at the time of writing on Friday amid mixed price actions across the crypto market. The remittance token failed to hold support at $1.40 the previous day, reflecting risk-off sentiment amid a decline in retail and institutional sentiment.