- EUR/USD moves below an ascending channel pattern, suggesting a bearish momentum shift.
- The 14-day RSI holding above the 70 mark signals a potential downward correction.
- The pair may find its primary support at the nine-day EMA of 1.0716 level,
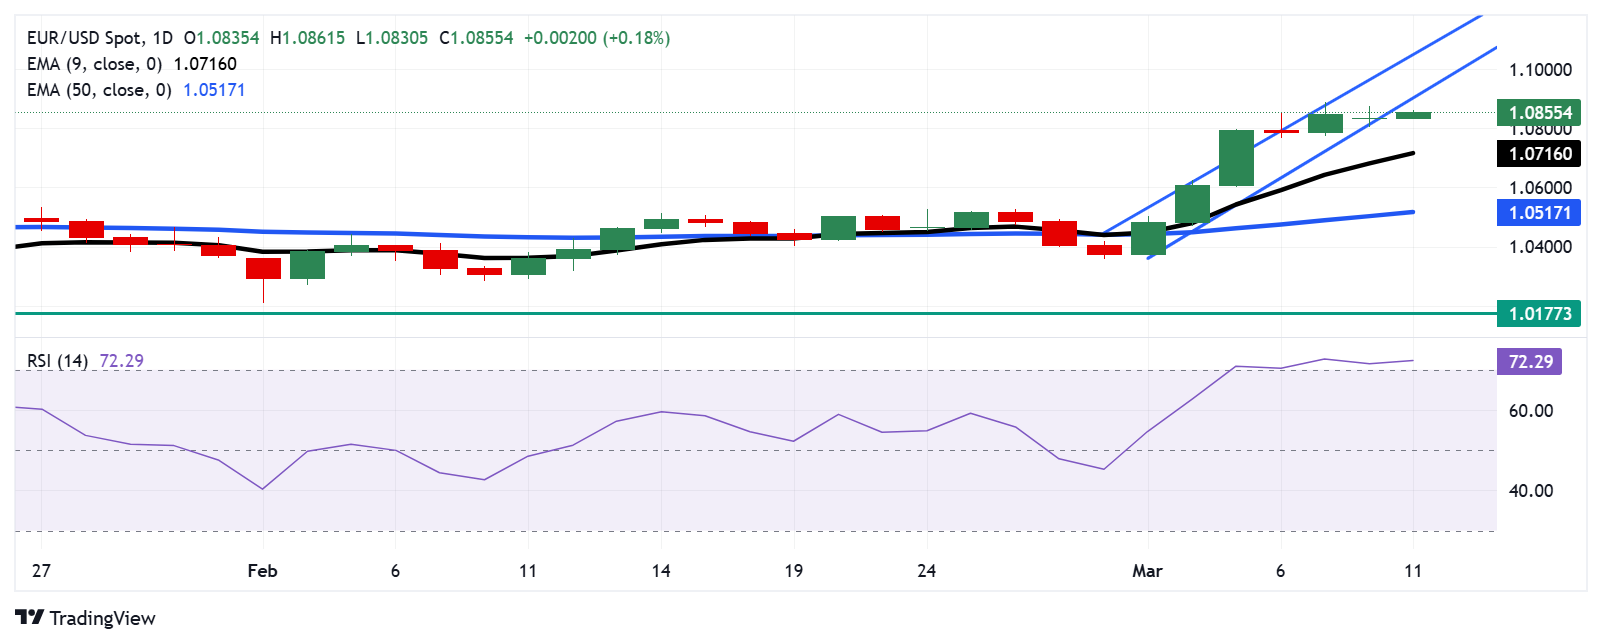
The EUR/USD pair gains ground for the third successive session, trading around 1.0860 during the Asian hours on Tuesday. A technical examination of the daily chart indicates a bearish breakout as the pair breaks below an ascending channel pattern, suggesting a shift in momentum from buyers to sellers.
Additionally, the 14-day Relative Strength Index (RSI), a key momentum indicator, is positioned slightly above 70, indicating an overbought situation and downward correction for the EUR/USD pair. However, the pair remains above both the nine-day and 14-day Exponential Moving Averages (EMAs), reinforcing strong short-term momentum.
A successful return to the ascending channel could reinforce the bullish bias and support the EUR/USD pair to explore the region around the upper boundary of the ascending channel at the 1.1050 level.
On the downside, the EUR/USD pair could find the primary support at the nine-day EMA of 1.0716 level, followed by the 50-day EMA at 1.0517 level. A break below this level would weaken the short-term price momentum and put downward pressure on the pair to navigate the area around the 1.0177 level—the lowest since November 2022, last recorded on January 1.
EUR/USD: Daily Chart
Euro PRICE Today
The table below shows the percentage change of Euro (EUR) against listed major currencies today. Euro was the strongest against the New Zealand Dollar.
USD | EUR | GBP | JPY | CAD | AUD | NZD | CHF | |
---|---|---|---|---|---|---|---|---|
USD | -0.17% | -0.12% | -0.19% | -0.06% | 0.04% | 0.08% | -0.22% | |
EUR | 0.17% | 0.07% | 0.02% | 0.12% | 0.22% | 0.26% | -0.04% | |
GBP | 0.12% | -0.07% | -0.06% | 0.05% | 0.16% | 0.20% | -0.09% | |
JPY | 0.19% | -0.02% | 0.06% | 0.13% | 0.23% | 0.27% | -0.02% | |
CAD | 0.06% | -0.12% | -0.05% | -0.13% | 0.11% | 0.14% | -0.15% | |
AUD | -0.04% | -0.22% | -0.16% | -0.23% | -0.11% | 0.05% | -0.25% | |
NZD | -0.08% | -0.26% | -0.20% | -0.27% | -0.14% | -0.05% | -0.29% | |
CHF | 0.22% | 0.04% | 0.09% | 0.02% | 0.15% | 0.25% | 0.29% |
The heat map shows percentage changes of major currencies against each other. The base currency is picked from the left column, while the quote currency is picked from the top row. For example, if you pick the Euro from the left column and move along the horizontal line to the US Dollar, the percentage change displayed in the box will represent EUR (base)/USD (quote).
Information on these pages contains forward-looking statements that involve risks and uncertainties. Markets and instruments profiled on this page are for informational purposes only and should not in any way come across as a recommendation to buy or sell in these assets. You should do your own thorough research before making any investment decisions. FXStreet does not in any way guarantee that this information is free from mistakes, errors, or material misstatements. It also does not guarantee that this information is of a timely nature. Investing in Open Markets involves a great deal of risk, including the loss of all or a portion of your investment, as well as emotional distress. All risks, losses and costs associated with investing, including total loss of principal, are your responsibility. The views and opinions expressed in this article are those of the authors and do not necessarily reflect the official policy or position of FXStreet nor its advertisers. The author will not be held responsible for information that is found at the end of links posted on this page.
If not otherwise explicitly mentioned in the body of the article, at the time of writing, the author has no position in any stock mentioned in this article and no business relationship with any company mentioned. The author has not received compensation for writing this article, other than from FXStreet.
FXStreet and the author do not provide personalized recommendations. The author makes no representations as to the accuracy, completeness, or suitability of this information. FXStreet and the author will not be liable for any errors, omissions or any losses, injuries or damages arising from this information and its display or use. Errors and omissions excepted.
The author and FXStreet are not registered investment advisors and nothing in this article is intended to be investment advice.
Recommended content
Editors’ Picks

EUR/USD stabilizes above 1.1350 on Easter Friday
EUR/USD enters a consolidation phase above 1.1350 on Friday as the trading action remains subdued, with major markets remaining closed in observance of the Easter Holiday. On Thursday, the European Central Bank (ECB) announced it cut key rates by 25 bps, as expected.

GBP/USD fluctuates below 1.3300, looks to post weekly gains
After setting a new multi-month high near 1.3300 earlier in the week, GBP/USD trades in a narrow band at around 1.32700 on Friday and remains on track to end the week in positive territory. Markets turn quiet on Friday as trading conditions thin out on Easter Holiday.

Gold ends week with impressive gains above $3,300
Gold retreated slightly from the all-time high it touched at $3,357 early Thursday but still gained more than 2% for the week after settling at $3,327. The uncertainty surrounding US-China trade relations caused markets to adopt a cautious stance, boosting safe-haven demand for Gold.

How SEC-Ripple case and ETF prospects could shape XRP’s future
Ripple consolidated above the pivotal $2.00 level while trading at $2.05 at the time of writing on Friday, reflecting neutral sentiment across the crypto market.

Future-proofing portfolios: A playbook for tariff and recession risks
It does seem like we will be talking tariffs for a while. And if tariffs stay — in some shape or form — even after negotiations, we’ll likely be talking about recession too. Higher input costs, persistent inflation, and tighter monetary policy are already weighing on global growth.

The Best brokers to trade EUR/USD
SPONSORED Discover the top brokers for trading EUR/USD in 2025. Our list features brokers with competitive spreads, fast execution, and powerful platforms. Whether you're a beginner or an expert, find the right partner to navigate the dynamic Forex market.