|

EUR/USD Price Analysis: Retreats from 1.0650 amid dismal market mood

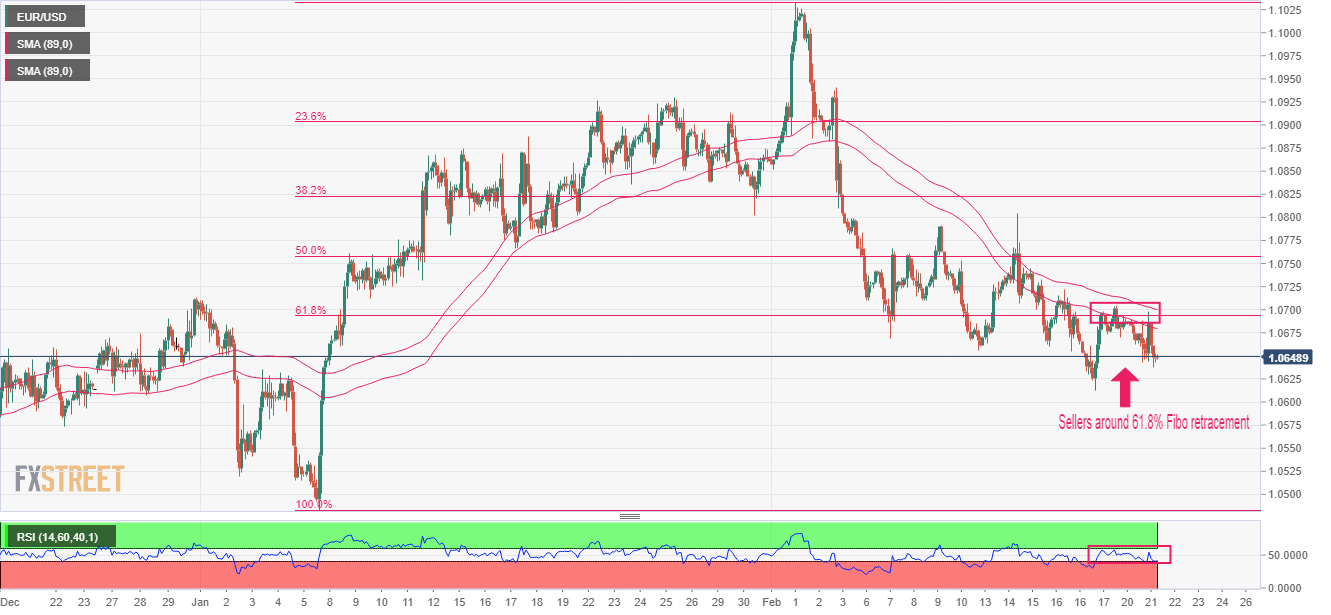
  • EUR/USD is continuously facing selling pressure from 61.8% Fibo retracement around 1.0700.
  • The 89-period (High-Low) SMA band is barricading the Euro consistently.
  • A slippage by the RSI (14) into the bearish range of 20.00-40.00 will trigger a downside momentum

The EUR/USD pair has retreated after facing selling interest around 1.0650 in the early Tokyo session. The major currency pair remained extremely volatile as upbeat United States preliminary S&P PMI data resulted in accelerating odds for the continuation of the policy tightening spell by the Federal Reserve (Fed).

Risk-perceived assets like S&P500 witnessed a vertical sell-off as upbeat US PMI data strengthened recession fears. The Fed is going to consider the rebound in the scale of economic activities as a threat to the declining trend in the Consumer Price Index (CPI), which will be addressed by more rate hikes. This pushed the alpha provided on the 10-year US Treasury bonds to 4%.

Meanwhile, the upbeat Eurozone ZEW Survey- Economic Sentiment failed to provide support to the Euro. Higher-than-anticipated sentiment data indicates that the majority of institutional investors are holding an optimistic view on the economic projections.

The presence of potential sellers at the 61.8% Fibonacci retracement (placed from January 6 low at 1.0483 to February high at 1.1033) at 1.0693 is heavily deploying pressure on EUR/USD. This could drag the shared currency pair further.

The 89-period (High-Low) Simple Moving Average (SMA) band is barricading the Euro consistently.

Meanwhile, the Relative Strength Index (RSI) (14) is on the verge of slipping into the bearish range of 20.00-40.00. An occurrence of the same will trigger a downside momentum.

A decisive downside move below February 17 low at 1.0613 will drag the asset toward December 22 low at 1.0573. A slippage below the latter will extend the downside toward January 6 low at 1.0483.

In an alternate scenario, a break above February 16 high at 1.0722 will drive the asset toward 50% Fibo retracement at 1.0758, followed by February 14 high around 1.0800.

EUR/USD two-hour chart

EUR/USD

Overview
Today last price1.0648
Today Daily Change-0.0037
Today Daily Change %-0.35
Today daily open1.0685
 
Trends
Daily SMA201.0788
Daily SMA501.0728
Daily SMA1001.0421
Daily SMA2001.033
 
Levels
Previous Daily High1.0705
Previous Daily Low1.067
Previous Weekly High1.0805
Previous Weekly Low1.0613
Previous Monthly High1.093
Previous Monthly Low1.0483
Daily Fibonacci 38.2%1.0683
Daily Fibonacci 61.8%1.0692
Daily Pivot Point S11.0668
Daily Pivot Point S21.0652
Daily Pivot Point S31.0634
Daily Pivot Point R11.0703
Daily Pivot Point R21.0721
Daily Pivot Point R31.0737

Author

Sagar Dua

Sagar Dua

FXStreet

Sagar Dua is associated with the financial markets from his college days. Along with pursuing post-graduation in Commerce in 2014, he started his markets training with chart analysis.

More from Sagar Dua
Share:

Editor's Picks

GBP/USD appears well offered near 1.3160

GBP/USD builds on Tuesday’s losses, although it now manages to pick up some pace and bounce off earlier multi-month troughs near 1.3140. The Greenback’s solid performance and continued political turmoil in the UK are keeping Cable under persistent pressure, with little sign of a meaningful recovery.

EUR/USD rebounds from lows, back to 1.1360

After bottoming out near 1.1320, EUR/USD gathers some traction and reclaims the 1.1350-1.1360 band as the NA session draws to a close on Wednesday. The pair’s drop to multi-month lows comes in response to the continuous leg higher in the US Dollar, which remains propped up by hawkish Fed expectations and uncertainty over the outcome of US-Iran peace negotiations.

Gold pressured near fresh 2026 lows

Gold accelerates its decline and gyrates around the key $4,000 mark per troy ounce on Wednesday, its lowest level since November 2025. In the meantime, tighter-for-longer Fed expectations and a broadly firmer US Dollar continue to weigh on the yellow metal, while uncertainty surrounding a potential US-Iran peace agreement has done little to revive demand for the safe haven space.

XRP nears key support as Fed hike risks suppress demand
Ripple (XRP) continues to face significant selling pressure, trading around $1.05 at the time of writing on Wednesday. This decline mirrors the broader weakness in the crypto market, exacerbated by mounting macroeconomic headwinds and persistent geopolitical uncertainties.
US-Iran talks: The next 60 days will decide where Oil prices go next
Oil markets received some encouraging news after weeks of rising tensions in the Middle East. But let’s not get ahead of ourselves: we’re far from victory, and markets just seem to have priced out the worst-case scenario. The US and Iran have reportedly made "substantive progress" in talks in Switzerland and agreed on a framework for working toward a broader deal within 60 days.
Regime change: Inside Kevin Warsh's first move to make the Fed unreadable on purpose

The rate did not move. That was the least interesting thing about Kevin Warsh's first meeting in charge of the Fed. The FOMC held its benchmark at 3.50%-3.75% for the fourth straight meeting, exactly as priced, and then the new chair used his first press conference to dismantle the machinery the market has leaned on for a decade.