|

EUR/USD Price Analysis: Moves below 1.0900, next support at nine-day EMA

  • EUR/USD loses ground as US Dollar attempts to rebound.
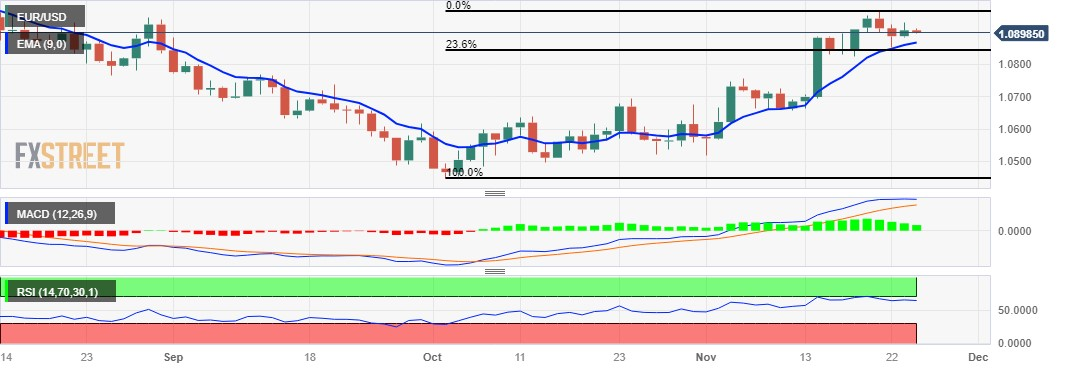
  • Technical indicators suggest revisiting the major level at 1.0950 near the three-month high.
  • The nine-day EMA at 1.0867 could act as the key support followed by the major level at 1.0850.

EUR/USD retraces the recent gains, trading below the psychological barrier at the 1.0900 level during the Asian session on Friday. The weakening of the Euro could be attributed to the improved US Dollar (USD). The Greenback recovers on the back of improved US Treasury yields.

The nine-day Exponential Moving Average (EMA) at 1.0867 appears to be the key support level aligned with the next major level at 1.0850. and the 23.6% Fibonacci retracement at 1.0842. A decisive break below the support region could push the EUR/USD pair to navigate the psychological level at 1.0800.

The technical indicators for the EUR/USD pair support the current upward trend. The 14-day Relative Strength Index (RSI) above 50 indicates bullish sentiment, indicating that the pair could revisit the major level at 1.0950, nearing the three-month high at 1.0965 level. A breakthrough above the latter could support the bulls of the EUR/USD pair to navigate the resistance area around the 1.1000 psychological level.

Furthermore, the Moving Average Convergence Divergence (MACD) line is above the centerline and the signal line, indicating a bullish momentum in the pair.

EUR/USD: Daily Chart

EUR/USD: more technical levels to watch

Overview
Today last price1.0898
Today Daily Change-0.0008
Today Daily Change %-0.07
Today daily open1.0906
 
Trends
Daily SMA201.0749
Daily SMA501.0649
Daily SMA1001.0793
Daily SMA2001.0809
 
Levels
Previous Daily High1.0931
Previous Daily Low1.0883
Previous Weekly High1.0909
Previous Weekly Low1.0665
Previous Monthly High1.0695
Previous Monthly Low1.0448
Daily Fibonacci 38.2%1.0913
Daily Fibonacci 61.8%1.0901
Daily Pivot Point S11.0882
Daily Pivot Point S21.0859
Daily Pivot Point S31.0834
Daily Pivot Point R11.093
Daily Pivot Point R21.0955
Daily Pivot Point R31.0978

Author

Akhtar Faruqui

Akhtar Faruqui is a Forex Analyst based in New Delhi, India. With a keen eye for market trends and a passion for dissecting complex financial dynamics, he is dedicated to delivering accurate and insightful Forex news and analysis.

More from Akhtar Faruqui
Share:

Editor's Picks

EUR/USD looks apathetic around 1.1770

EUR/USD comes under renewed pressure on Tuesday, deflating below the 1.1800 support and reversing two consecutive days of gains. The pair’s decline follows the persistent move higher in the US Dollar, as trade uncertainty dominates the sentiment ahead of President Trump’s SOTU speech.

GBP/USD regains 1.3500 and above

GBP/USD extends its advance for the third day in a row on Tuesday, this time retesting the area beyond the 1.3500 hurdle. Cable’s uptick comes despite decent gains in the Greenback and the dovish message from the BoE’s Bailey at the UK Parliament.

Gold appears offered around $5,150

Gold is giving back a good portion of the recent multi-day rally, receding to the $5,150 zone per troy ounce amid the decent bounce in the US Dollar and mixed US Treasuty yields. In the meantime, markets’ attention remain on upcoming comments from Fed speakers.

Ripple’s DeFi shift in focus: Navigating XRPL EVM sidechain growth, XRPFi migration and liquidity

Ripple (XRP) has continued to trade under pressure, extending its decline by approximately 63% from the record high of $3.66 in July. The remittance token is trading above support at $1.35, while its upside appears limited by key supply zones, starting with $1.40, at the time of writing on Tuesday.

The Citrini report: How a debatable AI narrative can shake Wall Street

That AI-related headline alone was enough to rattle investors.US stocks slid sharply on Monday after a widely circulated Citrini Research memo outlined a hypothetical “2028 Global Intelligence Crisis”, warning that rapid AI adoption could push US unemployment into double digits as early as by mid-2028.

XRP pressured by weak ETF flows and declining retail interest

Ripple (XRP) is edging lower, trading above its intraday low of $1.32 at the time of writing on Tuesday. The decline from its weekly opening of $1.39 reflects heightened volatility in the broader cryptocurrency market, accentuated by tariff-triggered uncertainty.