- EUR/USD drops as US-China tensions boost haven demand for the US dollar.
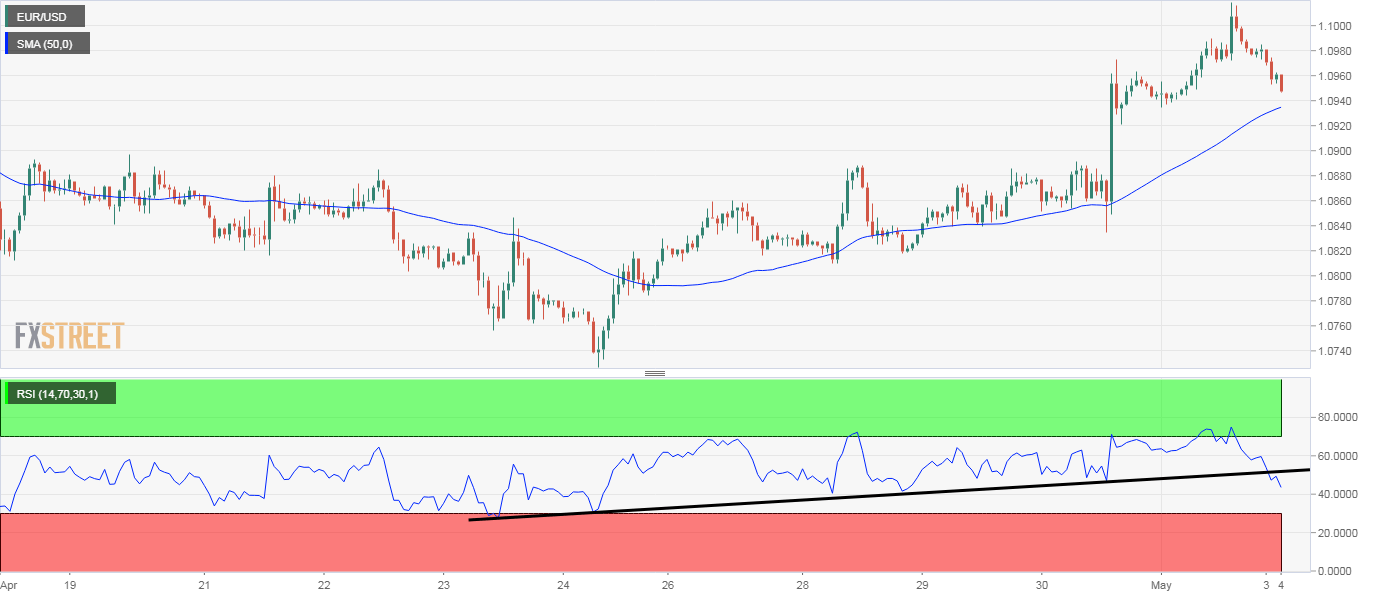
- The pair trades below the 50-day average amid bearish readings on intraday technical indicators.
EUR/USD is facing selling pressure alongside losses in the US stock futures and oil and is trading well below the 50-day average of 1.0964.
The risk has come under pressure during Monday's Asian trading hours with the Trump administration accusing China of intentionally spreading the coronavirus.
The pair could suffer additional losses over the next few hours, as the hourly chart relative strength index has dived out of an ascending trendline, signaling an end of the pair's bounce from the low of 1.0727.
Moreover, the risk aversion is likely to worsen with President Trump stating soon before press time that the US will end the trade deal reached in December last year if China does not buy the US goods.
EUR/USD could drop to the ascending 50-hour average support at 1.0935. Acceptance under that level would expose 1.09. The dip may be short-lived, as last week's gain confirmed a bullish reversal pattern on the weekly chart.
That said, a close above the 200-day average at 1.1033 is needed to put the bulls into the driver's seat.
Hourly chart
Trend: Pullback
Technical levels
Information on these pages contains forward-looking statements that involve risks and uncertainties. Markets and instruments profiled on this page are for informational purposes only and should not in any way come across as a recommendation to buy or sell in these assets. You should do your own thorough research before making any investment decisions. FXStreet does not in any way guarantee that this information is free from mistakes, errors, or material misstatements. It also does not guarantee that this information is of a timely nature. Investing in Open Markets involves a great deal of risk, including the loss of all or a portion of your investment, as well as emotional distress. All risks, losses and costs associated with investing, including total loss of principal, are your responsibility. The views and opinions expressed in this article are those of the authors and do not necessarily reflect the official policy or position of FXStreet nor its advertisers. The author will not be held responsible for information that is found at the end of links posted on this page.
If not otherwise explicitly mentioned in the body of the article, at the time of writing, the author has no position in any stock mentioned in this article and no business relationship with any company mentioned. The author has not received compensation for writing this article, other than from FXStreet.
FXStreet and the author do not provide personalized recommendations. The author makes no representations as to the accuracy, completeness, or suitability of this information. FXStreet and the author will not be liable for any errors, omissions or any losses, injuries or damages arising from this information and its display or use. Errors and omissions excepted.
The author and FXStreet are not registered investment advisors and nothing in this article is intended to be investment advice.
Recommended content
Editors’ Picks
AUD/USD failed just ahead of the 200-day SMA
Finally, AUD/USD managed to break above the 0.6500 barrier on Wednesday, extending the weekly recovery, although its advance faltered just ahead of the 0.6530 region, where the key 200-day SMA sits.
EUR/USD met some decent resistance above 1.0700
EUR/USD remained unable to gather extra upside traction and surpass the 1.0700 hurdle in a convincing fashion on Wednesday, instead giving away part of the weekly gains against the backdrop of a decent bounce in the Dollar.
Gold keeps consolidating ahead of US first-tier figures
Gold finds it difficult to stage a rebound midweek following Monday's sharp decline but manages to hold above $2,300. The benchmark 10-year US Treasury bond yield stays in the green above 4.6% after US data, not allowing the pair to turn north.
Bitcoin price could be primed for correction as bearish activity grows near $66K area
Bitcoin (BTC) price managed to maintain a northbound trajectory after the April 20 halving, despite bold assertions by analysts that the event would be a “sell the news” situation. However, after four days of strength, the tables could be turning as a dark cloud now hovers above BTC price.
Bank of Japan's predicament: The BOJ is trapped
In this special edition of TradeGATEHub Live Trading, we're joined by guest speaker Tavi @TaviCosta, who shares his insights on the Bank of Japan's current predicament, stating, 'The BOJ is Trapped.'