|

EUR/USD Price Analysis: Bulls are well-set to poke 1.0955 hurdle

  • EUR/USD renews nine-month high inside short-term rising wedge.
  • Nearly overbought RSI conditions suggest limited room towards the north.
  • 10-DMA restricts immediate downside, 1.0660 is the key support.
EUR/USD Price Analysis: Bulls are well-set to poke 1.0955 hurdle

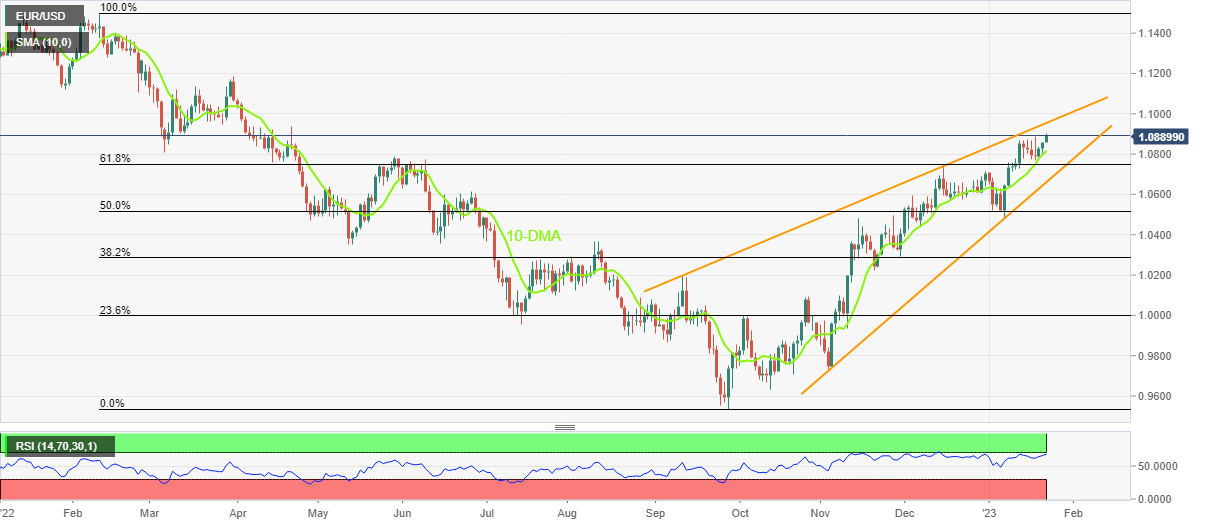
EUR/USD makes round to 1.0900 after rising to a fresh high since April 2022 heading into Monday’s European session.

In doing so, the Euro pair prints a three-day winning streak while staying firmer beyond the 10-DMA. However, the nearly overbought RSI and a 4.5-month-old rising wedge bearish chart formation challenges the buyers as of late.

It’s worth noting that the quote’s latest run-up aims for the April 2022 peak surrounding 1.0935 ahead of targeting the stated wedge’s top-line close to 1.0955.

Though, a successful run-up beyond 1.0955 will defy the bearish pattern and could quickly propel the prices toward the 1.1000 round figure.

In a case where the EUR/USD pair remains firmer past 1.1000, March 2022 peak surrounding 1.1185 will be in focus.

Alternatively, pullback moves remain elusive unless the quote stays above the 10-DMA support of 1.0815.

Following that, the 61.8% Fibonacci retracement level of the EUR/USD pair’s February-September 2022 downturn, around 1.0750, could lure the bears.

It should be observed that the EUR/USD’s weakness past 1.0750 highlights the stated wedge’s lower line, close to 1.0660, a break of which will confirm the bearish chart formation and can reverse the upward trajectory since late September 2022.

EUR/USD: Daily chart
Trend: Limited upside expected

Additional important levels

Overview
Today last price1.0892
Today Daily Change0.0036
Today Daily Change %0.33%
Today daily open1.0856
 
Trends
Daily SMA201.0711
Daily SMA501.0571
Daily SMA1001.0232
Daily SMA2001.031
 
Levels
Previous Daily High1.0859
Previous Daily Low1.0802
Previous Weekly High1.0888
Previous Weekly Low1.0766
Previous Monthly High1.0736
Previous Monthly Low1.0393
Daily Fibonacci 38.2%1.0838
Daily Fibonacci 61.8%1.0824
Daily Pivot Point S11.0819
Daily Pivot Point S21.0782
Daily Pivot Point S31.0762
Daily Pivot Point R11.0876
Daily Pivot Point R21.0896
Daily Pivot Point R31.0933

Author

Anil Panchal

Anil Panchal

FXStreet

Anil Panchal has nearly 15 years of experience in tracking financial markets. With a keen interest in macroeconomics, Anil aptly tracks global news/updates and stays well-informed about the global financial moves and their implications.


More from Anil Panchal
Share:

Editor's Picks

AUD/USD falls below 0.6700 as Unemployment Rate jumps to the highest level in five years

The AUD/USD pair tumbles to its lowest since January around 0.6695 during the early Asian session on Thursday. The Australian Dollar (AUD) faces some selling pressure against the US Dollar (USD) following weaker-than-expected Australian employment data. The weekly US Initial Jobless Claims report is due later on Thursday.


USD/JPY: Japanese Yen holds steady under 160.00 as Japan inflation data nears

The Dollar rose against most major currencies but not the Yen, which is backed by intervention warnings near 160.00 and an expected Bank of Japan hike. USD/JPY is unchanged on the session, just under 159.50, after three sessions of small declines from a high just above 160.00. That high was its highest since early September.


Gold falls to 14‑month low below $3,750 on hawkish Fed rhetoric

Gold price remains under selling pressure near $3,735 during the early Asian session on Thursday. The precious metal falls to its lowest level since September 2025 as hawkish Federal Reserve signals raised expectations of higher interest rates.


Bitcoin bearish signals deepen as demand contracts by 400K BTC
Bitcoin's (BTC) bearish outlook has intensified as weakening demand, rising realized losses and deteriorating market sentiment point to further pressure on the top crypto. In a Wednesday report, on-chain analytics firm CryptoQuant stated that Bitcoin's demand growth has contracted at its fastest pace since July 1, with declining spot demand leading the downturn.
The New Zealand Dollar is now cheaper than it has been since the pandemic

NZD/USD is extending its decline toward levels last seen in March 2020, when the Covid-19 pandemic triggered a global financial market sell-off. The New Zealand Dollar is struggling against the US Dollar, caught between a weakening domestic economy and increasingly restrictive monetary policy expectations in the United States.

Gold just broke below $3,800 for the first time in 14 months
Gold (XAU/USD) extends its decline on Wednesday, breaking below the psychological $3,800 level for the first time since September 2025 and continuing a sell-off that has accelerated in recent days. The latest decline marks a significant deterioration in Gold's outlook.