|

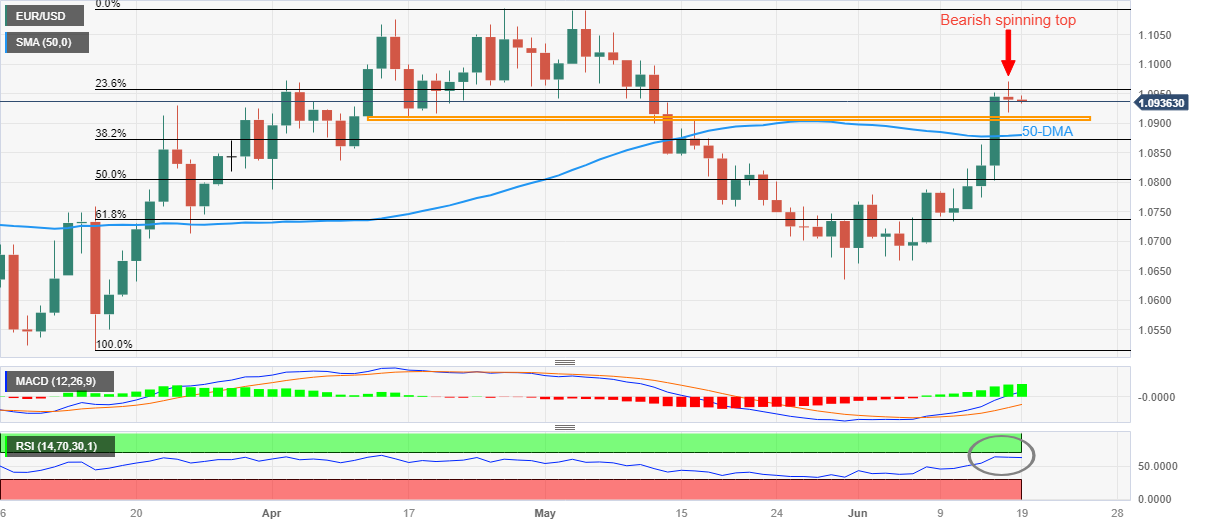
EUR/USD Price Analysis: Bearish spinning top, overbought RSI direct Euro sellers toward 1.0900

  • EUR/USD extends previous day’s pullback from five-week high, stays pressured of late.
  • Bearish candlestick formation, overbought RSI suggests further downside toward multi-day-old horizontal support.
  • Bullish MACD signals, 50-DMA can challenge Euro bears past 1.0900.
  • Euro buyers need validation from 1.0960 to retake control.

EUR/USD takes offers to reverse the late Friday’s corrective bounce, as well as the week-start inaction, as it justifies the previous day’s bearish candlestick formation amid overbought RSI conditions on early Monday in Europe. That said, the Euro pair renews its intraday low near 1.0930 while extending earlier pullback from the highest levels in five weeks.

It’s worth noting that the Juneteenth holiday in the US also joins the bearish spinning top candlestick on the daily chart of the EUR/USD pair and the overbought RSI (14) line to please the Euro bears of late.

With this, the quote appears all set to decline towards a nine-week-old horizontal support zone surrounding 1.0910-900.

However, the bullish MACD signals and the 50-DMA support of around 1.0880 can challenge the EUR/USD bears afterward.

In a case where the Euro pair drops below 1.0880, the odds of witnessing a slump towards the 50% and 61.8% Fibonacci retracement of its March-April run-up, respectively near 1.0800 and 1.0735, can’t be ruled out.

On the flip side, a daily closing beyond the 23.6% Fibonacci retracement of near 1.0960 and the previous day’s peak of around 1.0970 restrict the short-term EUR/USD upside.

Following that, multiple tops marked around 1.1000 can challenge the Euro bulls before directing them to the March 2022 high close to 1. 1185.

EUR/USD: Daily chart
Trend: Limited downside expected

Additional important levels

Overview
Today last price1.0936
Today Daily Change-0.0004
Today Daily Change %-0.04%
Today daily open1.094
 
Trends
Daily SMA201.0764
Daily SMA501.0879
Daily SMA1001.0807
Daily SMA2001.0542
 
Levels
Previous Daily High1.0971
Previous Daily Low1.0918
Previous Weekly High1.0971
Previous Weekly Low1.0733
Previous Monthly High1.1092
Previous Monthly Low1.0635
Daily Fibonacci 38.2%1.0938
Daily Fibonacci 61.8%1.095
Daily Pivot Point S11.0915
Daily Pivot Point S21.089
Daily Pivot Point S31.0862
Daily Pivot Point R11.0968
Daily Pivot Point R21.0996
Daily Pivot Point R31.1021

Author

Anil Panchal

Anil Panchal

FXStreet

Anil Panchal has nearly 15 years of experience in tracking financial markets. With a keen interest in macroeconomics, Anil aptly tracks global news/updates and stays well-informed about the global financial moves and their implications.


More from Anil Panchal
Share:

Editor's Picks

GBP/USD off highs, back to 1.3620

GBP/USD remains slightly on the defensive at the end of the week, receding to the low 1.3600s after hitting fresh tops past 1.3670 earlier in the day. Cable’s correction comes after two daily gains in a row and amid a tepid advance in the Greenback, while poor UK data also accompany the downside.

EUR/USD treads water below 1.1700

EUR/USD now trades with modest losses around 1.1670 following another unsuccessful atempt to advance past 1.1700 the figure in a convincing fashion. The pair’s decline follows a maginal rebound in the US Dollar as market participants continue to assess recent US data as well as developments from the US bond market.

Gold trims gains, recedes to the sub-$4,600 area

Gold rapidly leaves behind Thursday’s inconclusive price action and advances markedly on Friday, briefly surpassing the $4,600 mark per troy ounce to hit three-month peaks. Meanwhile, the precious metal’s solid performance comes despite marginal gains in the buck coupled with another day of rising US Treasury yields across the curve.

Crypto Today: Bitcoin, Ethereum, XRP bulls accelerate rally amid rising ETF inflows

The cryptocurrency market remains bullish on Friday, led by Bitcoin’s surge above $77,000. Altcoins, including Ethereum and Ripple, mirror BTC’s positive outlook, trading near $2,400 and $1.35, respectively.

Week ahead – Fed’s Jackson Hole and Nvidia earnings to dictate markets

Kevin Warsh to make his Jackson Hole debut amid confusing messaging. But a major hawkish surprise unlikely after bond market intervention. Nvidia earnings to also determine market direction as stock rally cools.

$20 billion offered, $2 billion taken: Why Treasury doubled its buyback cap

The US Treasury moved off its own calendar on Wednesday, and that is the part worth sitting with. At 12:32 GMT, the department said it would at least double the size of liquidity support buyback operations in the 10-year to 20-year and 20-year to 30-year sectors, lifting the maximum from $2 billion per operation to at least $4 billion, effective September 9 and running to November 4.