EUR/USD - No signs of stress ahead of D-Day in Catalan Crisis

The pullback in the EUR/USD pair from the high of 1.2092 seems to have bottomed out 1.17 levels despite the Catalan crisis.
A minor drop to 1.1669 on Oct 6 was quickly undone even though the US-German 10-year yield spread continues to gain altitude. The spread currently stands at 191 basis points; the highest level since mid June.
Focus on Catalan President Carles Puigdemont's speech
The focus of the deepening clash between Catalan separatists and Spanish authorities has shifted to Catalan President Carles Puigdemont's key address to the regional parliament. Some expect a strictly symbolic declaration, while others believe a risky full-scale break with Spain will be attempted.
Mayor Ada Colau has urged Puigdemont not to declare independence, and also called on Mr Rajoy to rule out direct control from Madrid. German Chancellor Angela Merkel also "affirmed her backing for the unity of Spain" in a phone call with Mr Rajoy. Thousands also took to the streets of Barcelona on Sunday to oppose independence.
It is quite clear the Catalan crisis is not Spain's internal issue, but one that is a threat to the EU project. However, there are no signs of stress in the EUR/USD market.
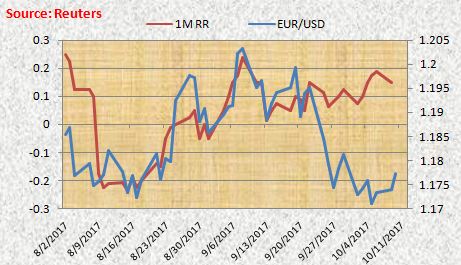
Vols remain low, Risk Reversals hover in positive territory
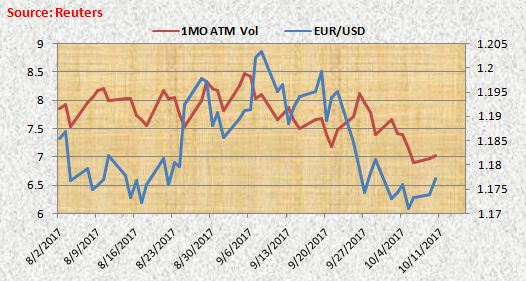
- The one-month ATM volatility has ticked higher to 7.07 from Friday's 6.90, but remains well below the September 26 high of 8.125.
- The one-month 25-delta risk reversals remain flat lined around 0.15. The positive number indicates calls are more in demand.
Clearly, investors are under appreciating the risks associated with the Catalan crisis and believe the separatist agenda will be eventually put to rest.
EUR/USD Technical Levels
FXStreet Chief Analyst Valeria Bednarik writes, " From a technical point of view, the pair has gained some bullish traction in the short term, but would take the price to settle above the 1.1820/30 strong static resistance area to see the pair actually turning positive and bulls daring for more. In the meantime, the 4 hours chart shows that the price advanced above 1.1730, which in the mentioned chart presents its 20 SMA, while the level also represents the 23.6% retracement of the April/September rally. Indicators in the mentioned chart head modestly higher after entering positive territory, supporting some additional gains up to the 1.1780 region, the immediate resistance. Below the mentioned Fibonacci support, on the other hand, the risk turns towards the downside, with scope then for a retest of the 1.1660 price zone."
Support levels: 1.1730 1.1695 1.1660
Resistance levels: 1.1780 1.1825 1.1850
Author

Omkar Godbole
FXStreet Contributor
Omkar Godbole, editor and analyst, joined FXStreet after four years as a research analyst at several Indian brokerage companies.


