Top Crypto Losers: Pump.fun, Story, and Pudgy Penguins test key support levels
- Pump.fun reversed 11% on Wednesday from its 50-day EMA, risking a drop below its 20-day EMA.
- Story is down over 6% in the last 24 hours, approaching the $2 psychological support.
- Pudgy Penguins tests the 50-day EMA as bullish momentum wanes after Wednesday’s 9% decline.

Pump.fun (PUMP), Story (IP), and Pudgy Penguins (PENGU) experience intense selling pressure over the last 24 hours. PUMP and IP failed to cross the 50-day Exponential Moving Average (EMA), resulting in a pullback on Wednesday, while PENGU is testing its 50-day EMA. The technical outlook for these cryptocurrencies remains bearish due to the prevailing downtrend.
Pump.fun at risk of further decline as bullish momentum wanes
Pump.fun trades above the 20-day EMA at $0.002248 at press time on Thursday, following an 11% drop from the 50-day EMA at $0.002624 on the previous day, breaking the eight-day streak of uptrend.
If the meme coin launchpad token extends below $0.0002248, it could extend the decline to the $0.002000 psychological mark, followed by the S1 Pivot Point at $0.001262.
The technical indicators on the daily chart suggest a decline in buying pressure. The Relative Strength Index (RSI) is at 51, declining toward the halfway line. Meanwhile, the Moving Average Convergence Divergence (MACD) turns flat, as declining green histogram bars signal a decline in bullish momentum.
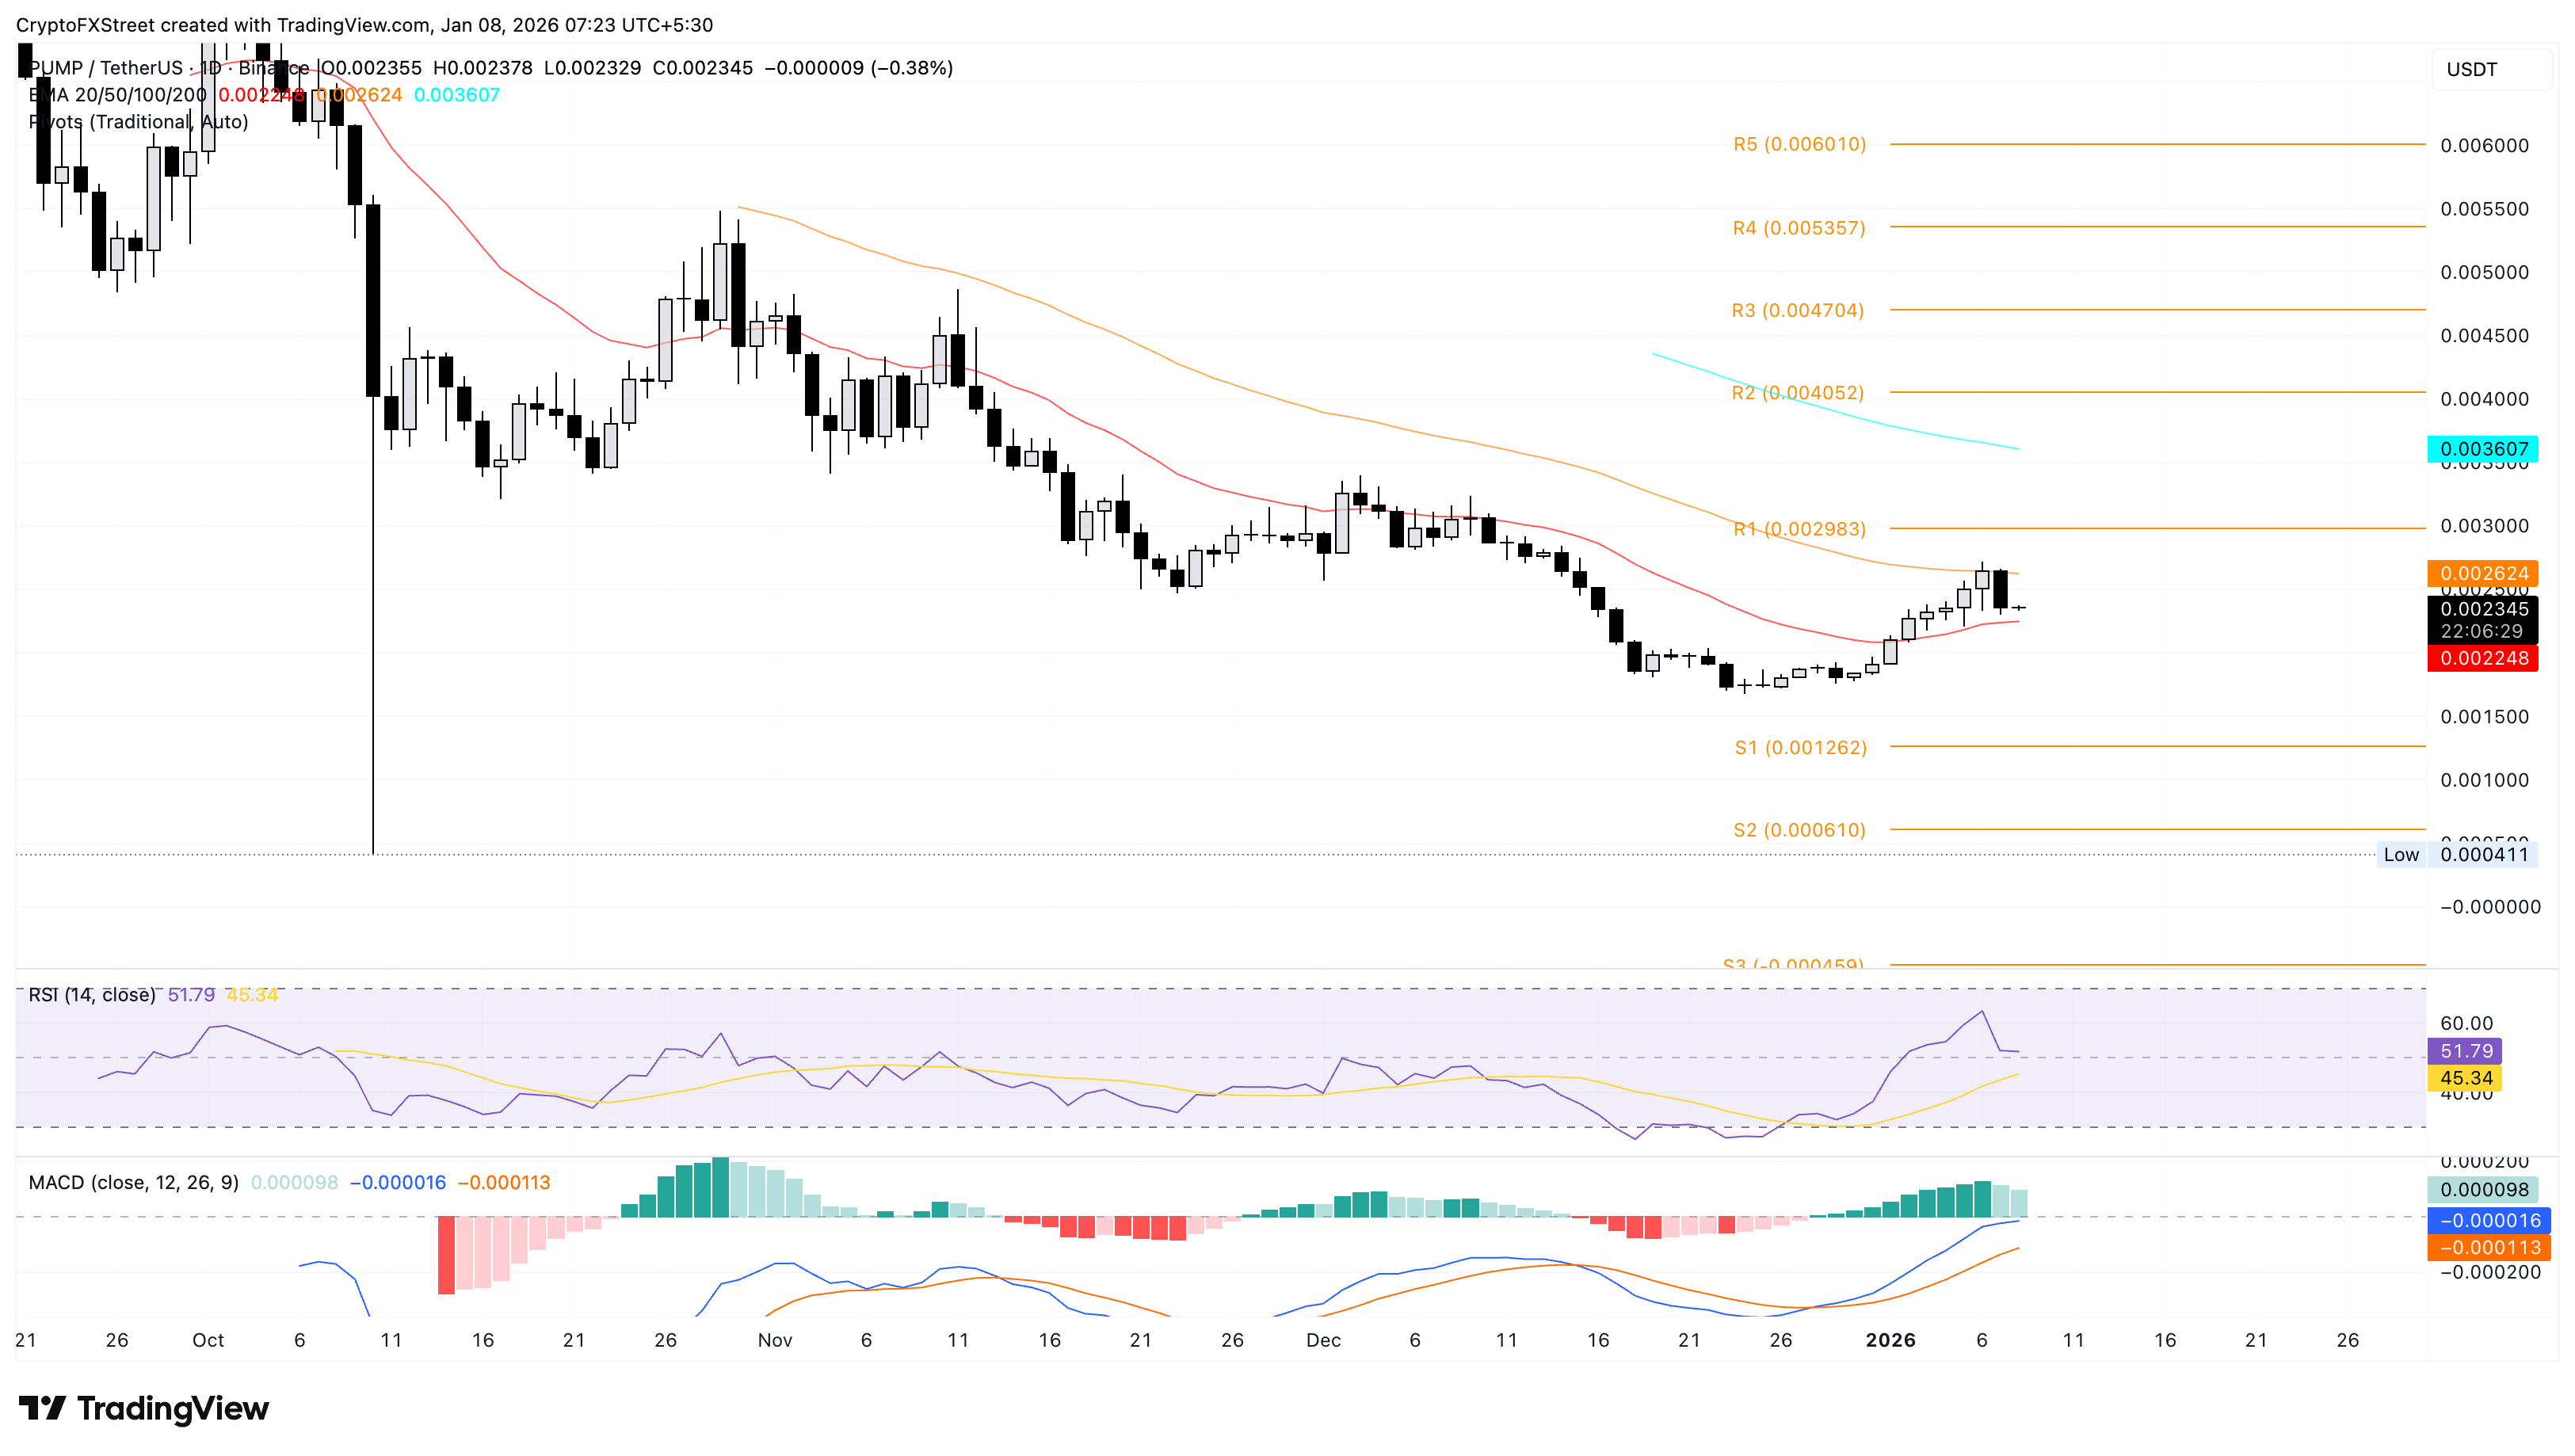
If PUMP rebounds to clear the 50-day EMA at $0.002624, it could target the R1 Pivot Point at $0.002983.
Story hits the crucial crossroads at $2.00
Story trades around $2.00 at the time of writing on Thursday, marking its third consecutive bearish day. The meme coin is down 2%, extending the 4% decline from the previous day and risking the 20-day EMA at $1.91.
If IP falls below $1.91, it could further decline to the S1 Pivot Point at $1.22.
Similar to PUMP, the technical indicators on the daily chart point to declining buying pressure in Story. The RSI is at 53, slipping closer to the halfway line while the MACD approaches the signal line risking a crossover which would indicate renewed bearish momentum.
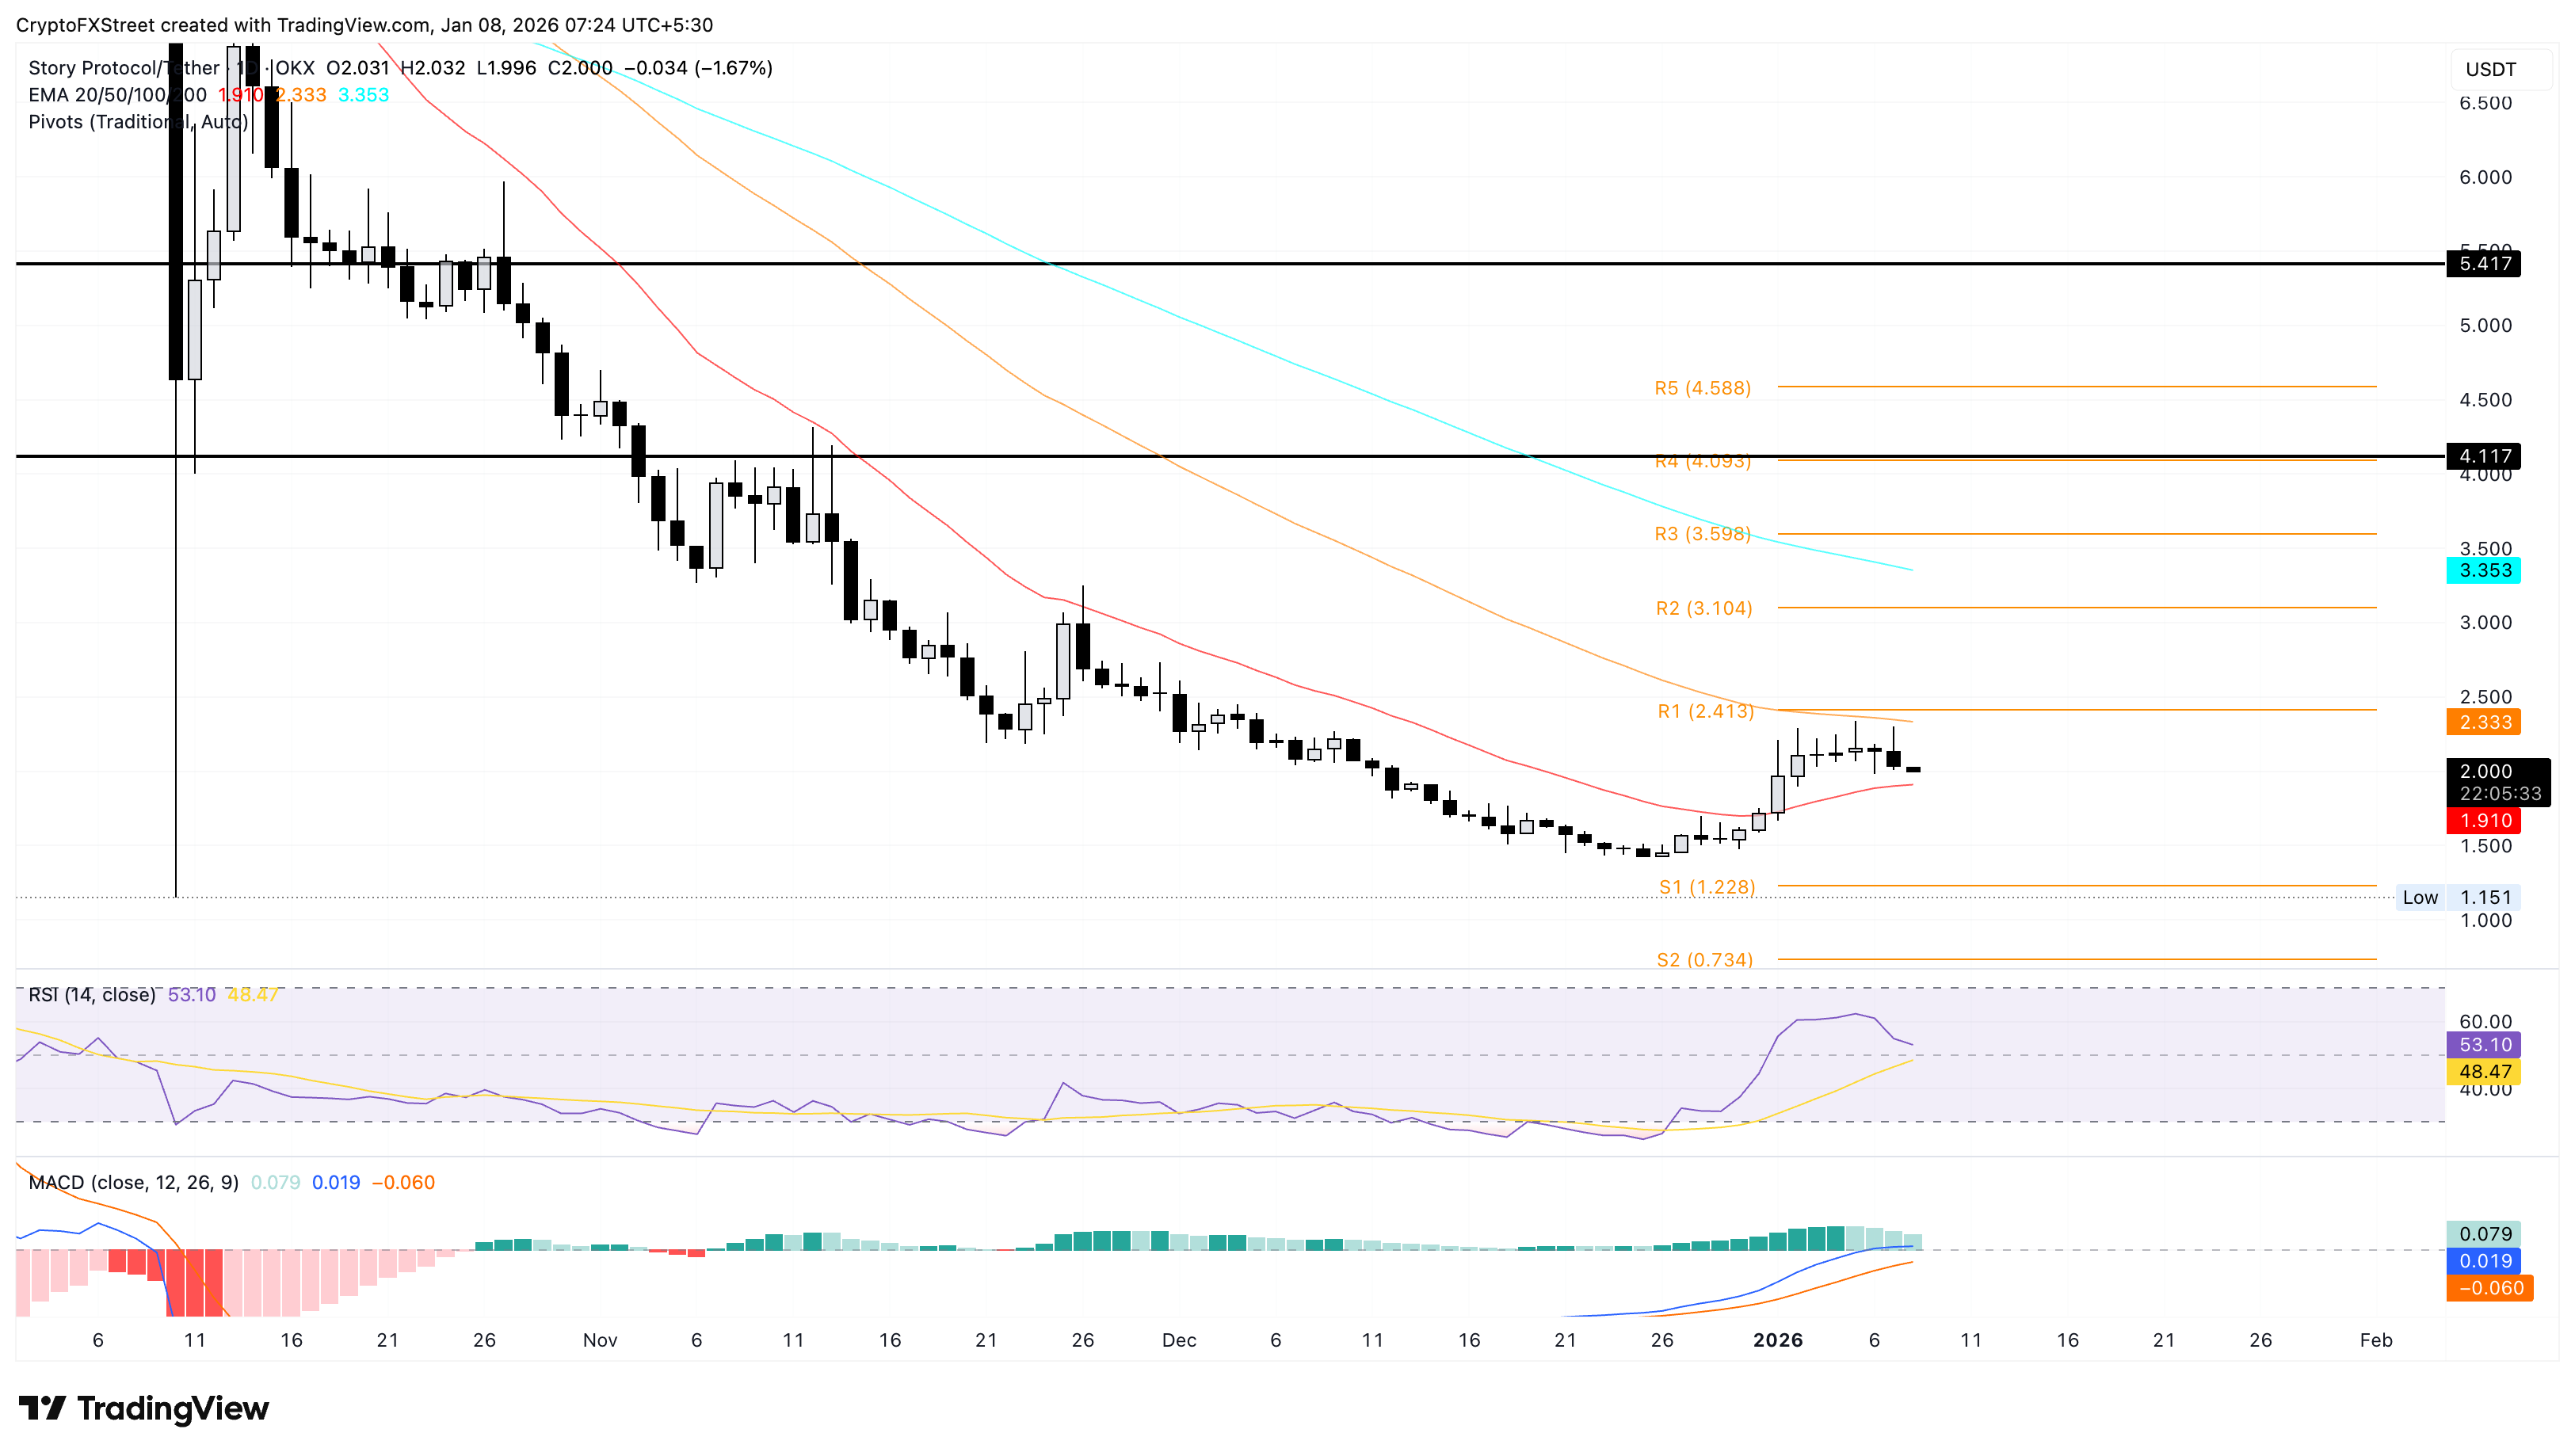
To reinstate an upward trend, IP should exceed the 50-day EMA at $2.33, potentially targeting the R1 Pivot Point at $2.41.
Pudgy Penguins risks losing the 50-day EMA
Pudgy Penguins holds above the 50-day EMA at $0.01179 following a 9% correction on Wednesday. At the time of writing, PENGU is trading around $0.1200 close to the R1 Pivot Point at $0.01193.
If PENGU slips below this level, the 20-day EMA at $0.01091 close to the $0.01000 psychological level could serve as an immediate support.
Similar to PUMP and PENGU, Pudgy Penguins is losing buying pressure, as indicated by the technical indicators on the daily chart.
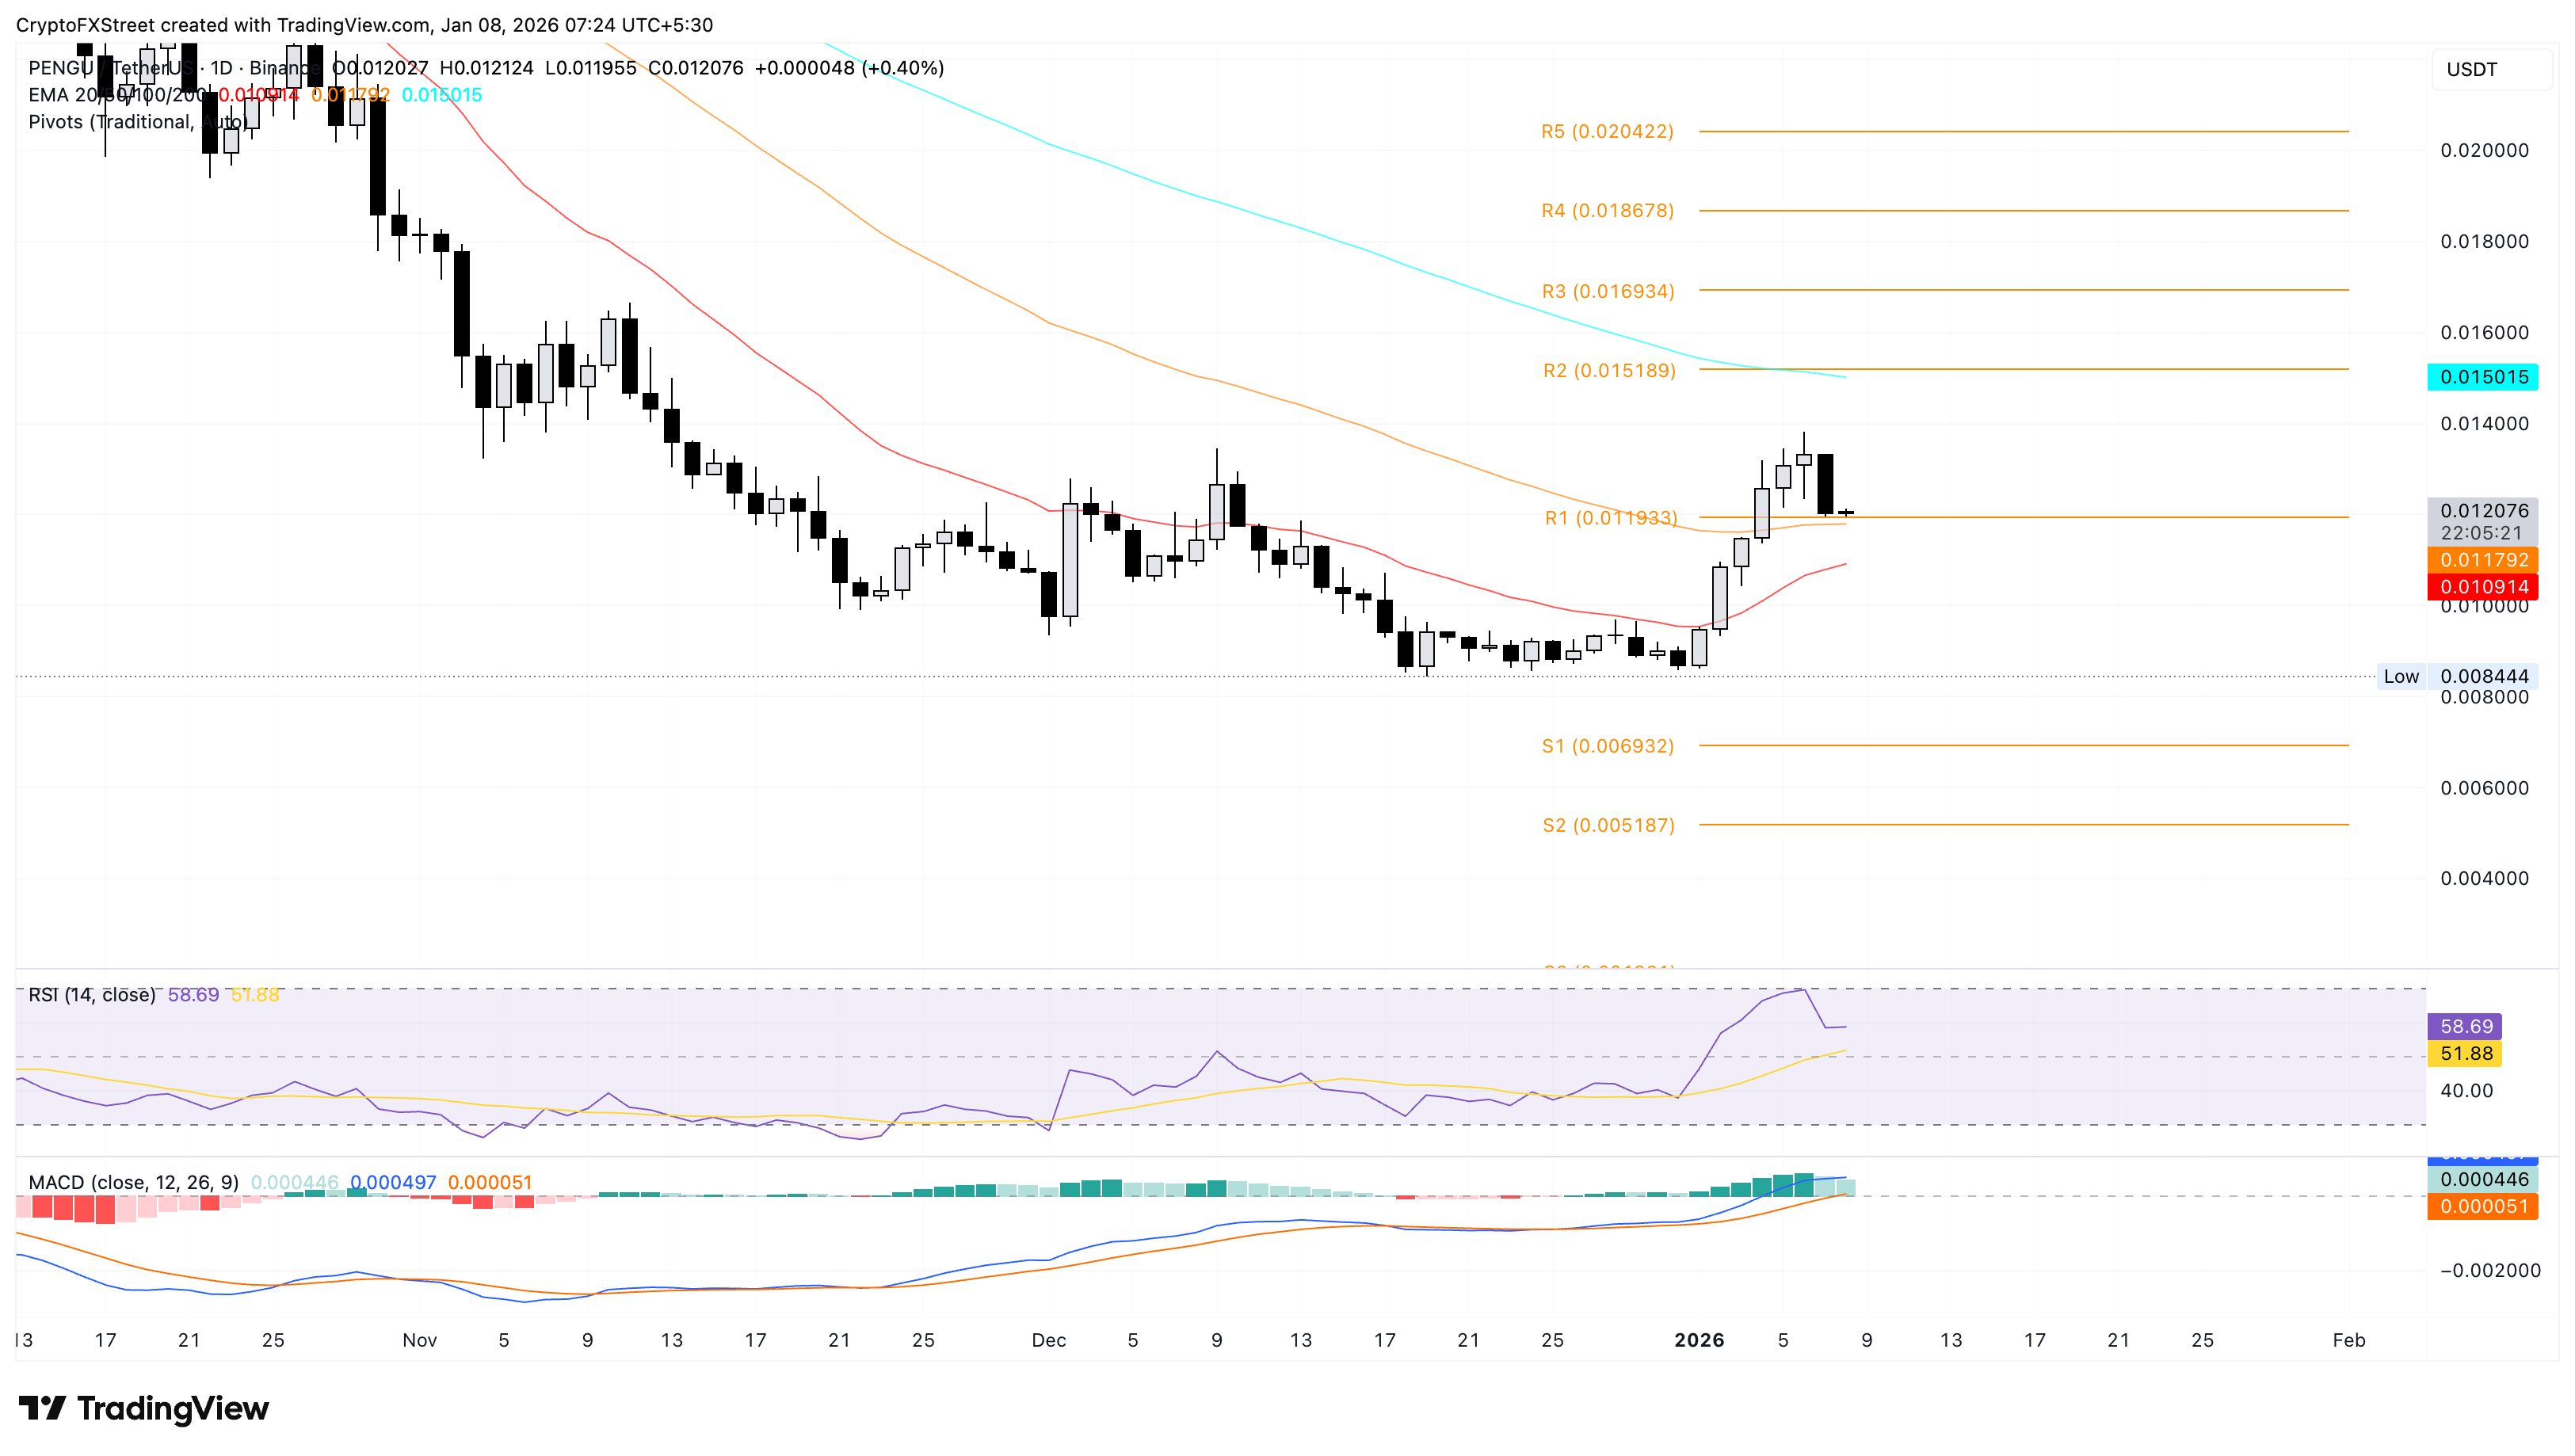
Looking up, a potential rebound in PENGU could target the R1 Pivot Point at $0.01518.
Author

Vishal Dixit
FXStreet
Vishal Dixit holds a B.Sc. in Chemistry from Wilson College but found his true calling in the world of crypto.


