EUR/USD holds losses as markets await US ISM Manufacturing PMI figures
- EUR/USD hits four-week lows below 1.1700 amid the US Dollar's strength.
- FX markets are looking beyond the geopolitical tensions after the US intervention in Venezuela
- Investors await a slew of US macroeconomic data for further insight into the Fed easing calendar.

EUR/USD has opened the week on the same soft tone that closed the previous one. The pair trades at four-week lows of 1.1690 at the time of writing, with traders trying to look ahead to the US intervention in Venezuela into a slew of key US macroeconomic releases due later in the week.
Venezuelan President Nicolas Maduro is expected to appear in a US court later on Monday, after being captured by US forces over the weekend, and US President Donald Trump has warned about the possibility of further attacks on the country if the authorities do not cooperate with US plans to open up the country's Oil industry and stop drug trafficking.
Market sentiment, however, has hardly been affected by the weekend's events. The main Asian indices have been trading higher, and European markets are pointing to a mildly positive opening.
In FX markets, the trend of a stronger US Dollar (USD) observed late last week has extended into this one. Upbeat US home sales and Jobless Claims data last week strengthened the US Federal Reserve's (Fed) stance of a very gradual easing cycle,
Investors await the US ISM Manufacturing Purchasing Managers' Index (PMI) due later on Monday to confirm those views, although the highlight of the week will be December's Nonfarm Payrolls report, due on Friday.
Euro Price Today
The table below shows the percentage change of Euro (EUR) against listed major currencies today. Euro was the strongest against the Canadian Dollar.
| USD | EUR | GBP | JPY | CAD | AUD | NZD | CHF | |
|---|---|---|---|---|---|---|---|---|
| USD | 0.23% | 0.17% | 0.09% | 0.25% | 0.22% | 0.19% | 0.18% | |
| EUR | -0.23% | -0.07% | -0.11% | 0.02% | -0.01% | -0.04% | -0.05% | |
| GBP | -0.17% | 0.07% | -0.06% | 0.08% | 0.06% | 0.03% | 0.01% | |
| JPY | -0.09% | 0.11% | 0.06% | 0.15% | 0.13% | 0.10% | 0.09% | |
| CAD | -0.25% | -0.02% | -0.08% | -0.15% | -0.03% | -0.05% | -0.07% | |
| AUD | -0.22% | 0.00% | -0.06% | -0.13% | 0.03% | -0.03% | -0.04% | |
| NZD | -0.19% | 0.04% | -0.03% | -0.10% | 0.05% | 0.03% | -0.01% | |
| CHF | -0.18% | 0.05% | -0.01% | -0.09% | 0.07% | 0.04% | 0.01% |
The heat map shows percentage changes of major currencies against each other. The base currency is picked from the left column, while the quote currency is picked from the top row. For example, if you pick the Euro from the left column and move along the horizontal line to the US Dollar, the percentage change displayed in the box will represent EUR (base)/USD (quote).
Daily Digest Market Movers: US Dollar gains as investors reassess Fed easing bets
- The US Dollar has opened 2026 on a strong note. Last week, US Pending Home Sales and US Jobless Claims figures beat expectations, and the US S&P Global Manufacturing PMI confirmed a moderate growth of the sector's activity and endorsed the Fed hawks' view supporting a cautious approach to interest rate cuts, considering the sticky inflationary pressures.
- The growing geopolitical tensions after the attack on Venezuela have had a minor impact on markets so far. Stocks rose in Asia, and Oil prices fell in a sign that investors are looking beyond Maduro's capture, focusing on the US economic figures, due to be released this week
- The US calendar opens this week with the ISM Manufacturing PMI, which is expected to show a minor improvement to 48.3 in December from 48.2 in the previous month.
- The highlight of the week, however, will be December's Nonfarm Payrolls report, which will be observed with interest to assess the momentum of the US labour market and will provide further insight into the Fed's interest rate path.
Technical Analysis: EUR/USD is clinging to 1.1670 support
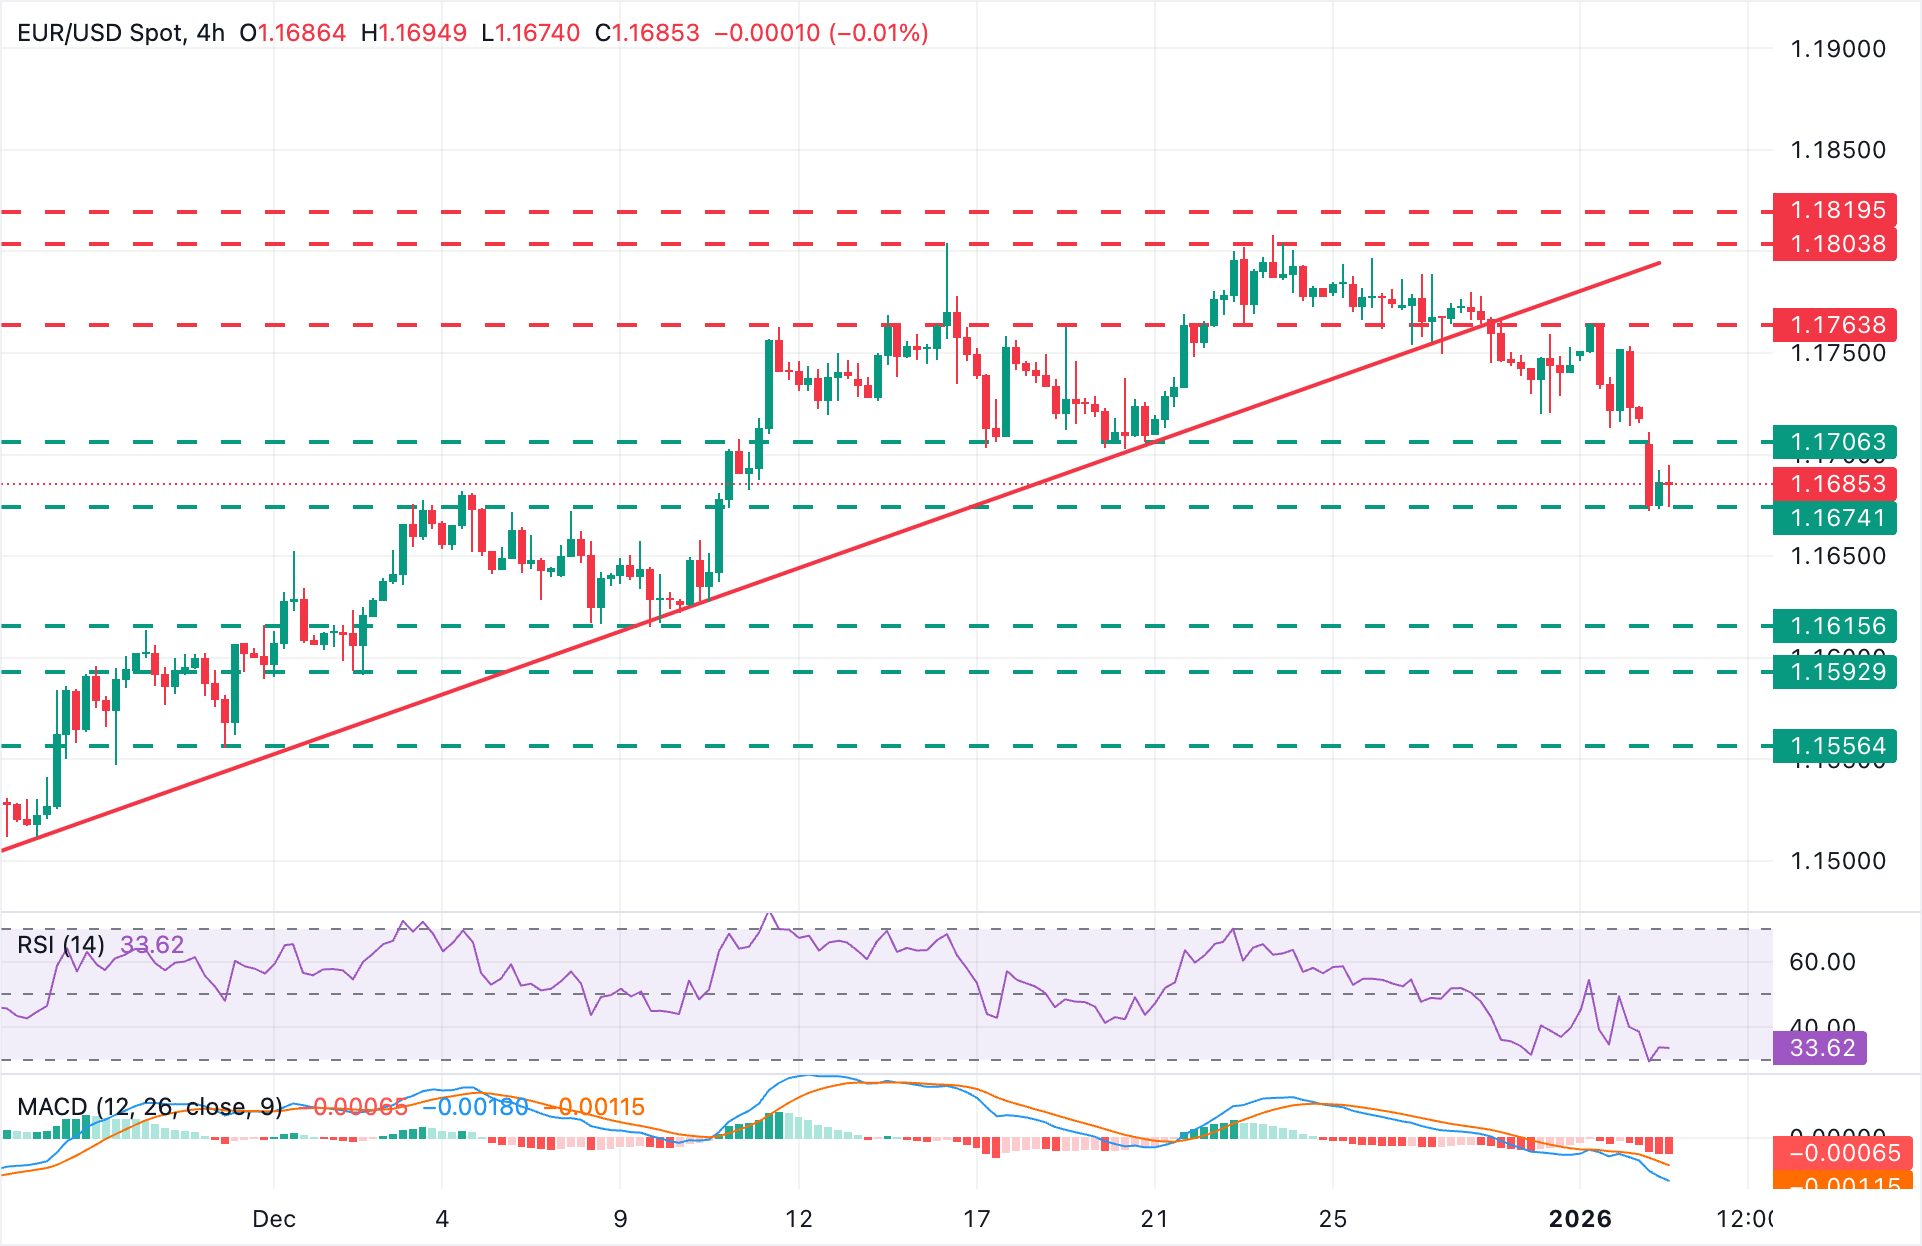
The EUR/USD has extended its correction from 1.1800 highs to four-week lows below 1.1700, and technical indicators point to further decline. The 4-hour Relative Strength Index (RSI) is near 30, and the Moving Average Convergence Divergence (MACD) is printing red bars, highlighting a strong bearish momentum.
The pair has found support near 1.1670, but so far, it seems unable to post any significant recovery. Further down, the 50% Fibonacci retracement of the November-December rally, at 1.1650, might provide support ahead of the 1.1615 area, where the December 8 and 9 lows meet the 61.8% Fibonacci retracement of the mentioned cycle.
A bullish reaction should breach previous support levels at the 1.1715-1.1720 area (December 31, January 2 lows) to ease negative pressure and aim for the January 2 high, at 1.1765.
Economic Indicator
ISM Manufacturing PMI
The Institute for Supply Management (ISM) Manufacturing Purchasing Managers Index (PMI), released on a monthly basis, is a leading indicator gauging business activity in the US manufacturing sector. The indicator is obtained from a survey of manufacturing supply executives based on information they have collected within their respective organizations. Survey responses reflect the change, if any, in the current month compared to the previous month. A reading above 50 indicates that the manufacturing economy is generally expanding, a bullish sign for the US Dollar (USD). A reading below 50 signals that factory activity is generally declining, which is seen as bearish for USD.
Read more.Next release: Mon Jan 05, 2026 15:00
Frequency: Monthly
Consensus: 48.3
Previous: 48.2
Source: Institute for Supply Management
The Institute for Supply Management’s (ISM) Manufacturing Purchasing Managers Index (PMI) provides a reliable outlook on the state of the US manufacturing sector. A reading above 50 suggests that the business activity expanded during the survey period and vice versa. PMIs are considered to be leading indicators and could signal a shift in the economic cycle. Stronger-than-expected prints usually have a positive impact on the USD. In addition to the headline PMI, the Employment Index and the Prices Paid Index numbers are watched closely as they shine a light on the labour market and inflation.
Economic Indicator
ISM Manufacturing Employment Index
The Institute for Supply Management (ISM) Manufacturing Index shows business conditions in the US manufacturing sector, taking into account expectations for future production, new orders, inventories, employment and deliveries. It is a significant indicator of the overall economic condition in US. The ISM Manufacturing Employment Index represents business sentiment regarding labor market conditions and is considered a strong Non-Farm Payrolls leading indicator. A high reading is seen as positive for the USD, while a low reading is seen as negative.
Read more.Next release: Mon Jan 05, 2026 15:00
Frequency: Monthly
Consensus: -
Previous: 44
Source: Institute for Supply Management
Author

Guillermo Alcala
FXStreet
Graduated in Communication Sciences at the Universidad del Pais Vasco and Universiteit van Amsterdam, Guillermo has been working as financial news editor and copywriter in diverse Forex-related firms, like FXStreet and Kantox.


