|

EUR/JPY Technical Analysis: Remains under pressure around 4-week lows

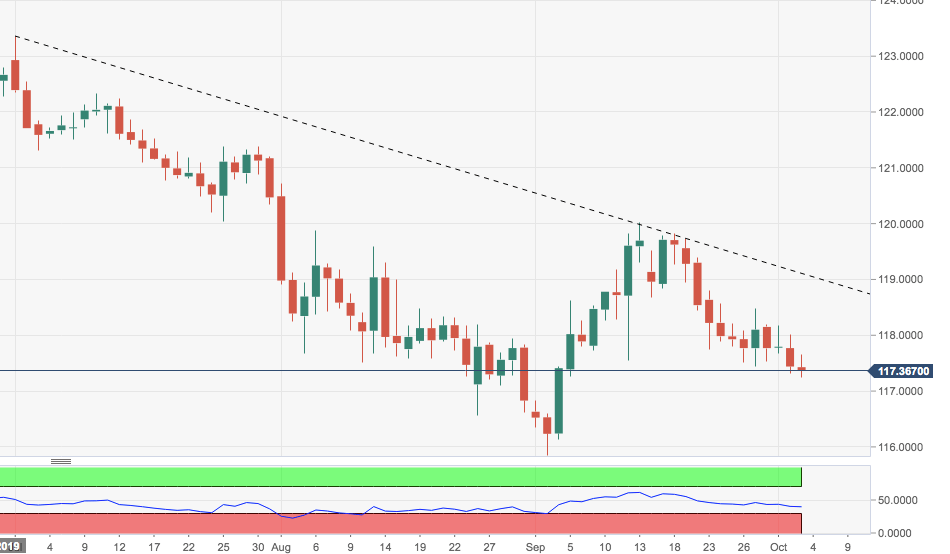
  • EUR/JPY keeps the bearish view unchanged so far this week, dropping and rebounding from new multi-week lows near 117.20.
  • Immediately to the downside emerges the late August low at 116.56 ahead of the 2019 low at 115.86 recorded on September 3rd.
  • On the broader view, while the 3-month resistance line at 119.09 caps the upside, the negative stance remains intact.

EUR/JPY daily chart

EUR/JPY

Overview
Today last price117.43
Today Daily Change41
Today Daily Change %-0.01
Today daily open117.44
 
Trends
Daily SMA20118.52
Daily SMA50118.49
Daily SMA100120.22
Daily SMA200122.63
 
Levels
Previous Daily High118.01
Previous Daily Low117.32
Previous Weekly High118.8
Previous Weekly Low117.44
Previous Monthly High120.01
Previous Monthly Low115.86
Daily Fibonacci 38.2%117.58
Daily Fibonacci 61.8%117.74
Daily Pivot Point S1117.17
Daily Pivot Point S2116.89
Daily Pivot Point S3116.47
Daily Pivot Point R1117.86
Daily Pivot Point R2118.28
Daily Pivot Point R3118.56

Author

Pablo Piovano

Born and bred in Argentina, Pablo has been carrying on with his passion for FX markets and trading since his first college years.

More from Pablo Piovano
Share:

Editor's Picks

EUR/USD gathers strength to near 1.1550 ahead of ECB rate decision

The EUR/USD pair trades in positive territory near 1.1540 during the early Asian trading hours on Thursday. Rising bets that the European Central Bank will deliver a rate hike at its June policy meeting later on Thursday underpin the Euro against the Greenback. 


GBP/USD nudges higher above 1.3350 despite rising Fed hike bets

The GBP/USD pair gathers strength to around 1.3385 during the Asian trading hours on Thursday. However, the potential upside might be limited amid rising expectations for higher-for-longer US interest rates. Markets might turn cautious later in the day ahead of the US Producer Price Index report.

Gold recovers slightly from November 2025 lows; not out of the woods yet

Gold extends the recent breakdown momentum below the 200-day SMA and plummets to its lowest level since November 2025 during the Asian session on Thursday. Renewed hostilities between the US and Iran push Crude Oil prices higher, reviving inflationary concerns and bolstering bets for more hawkish central banks. This continues to drive flows away from the non-yielding bullion, though subdued US Dollar demand helps spot prices to find some support ahead of the $4,000 psychological mark.

Bitcoin faces further downside risk amid growing short-term holder losses, weak ETF demand

Bitcoin's recent decline toward the $60,000 level has pushed the market further into bearish territory, with new investors suffering huge unrealized losses, according to a Glassnode report on Wednesday. The firm noted that Bitcoin's earlier May rally now appears increasingly as a "bear bounce".

From sizzle to fizzle: Tech sinks as Oil puts the Fed tail back on the table
Wall Street was not hit by one punch. It was caught between three swinging doors at the same time: a renewed technology unwind, a fresh geopolitical oil bid, and a wave of equity supply that is starting to look less like capital formation and more like a liquidity test for the entire AI complex.
The US economy defies the rules: 100 days into the Oil shock and the recession signal is still missing

More than three months after the start of the Iran war and the resulting disruption to global energy markets, the US economy continues to display remarkable resilience. The conflict has triggered a sharp rise in Oil prices, reignited inflationary pressures and fueled widespread concerns about a potential economic slowdown.