• EUR/JPY tumbles but remains above the 20-day EMA, despite RSI’s shifting bearish.
  • Short term, the EUR/JPY might re-test the October 5 low of 142.44 before resuming its downtrend towards 141.00.

EUR/JPY continues to fall for the second straight day due to market sentiment turning sour, as portrayed by Wall Street’s set to finish with losses, while US Federal Reserve policymakers remain committed to crushing inflation. At the time of writing, the EUR/JPY is trading at 142.24, down by 0.51%.

EUR/JPY Price Forecast

The EUR/JPY daily chart portrays the pair’s faced solid support at the 20-day EMA around 142.08. Even though Thursday’s daily low was 141.95, sellers could not hold the fort, so the EUR/JPY reclaimed 142.00. It should be noted that the Relative Strength Index (RSI) just crossed below the 7-day RSI’s SMA, indicating that sell orders could be beginning to pile in the pair. Unless the EUR/JPY registers a daily close below 142.00, the pair is still neutral-to-upward biased.

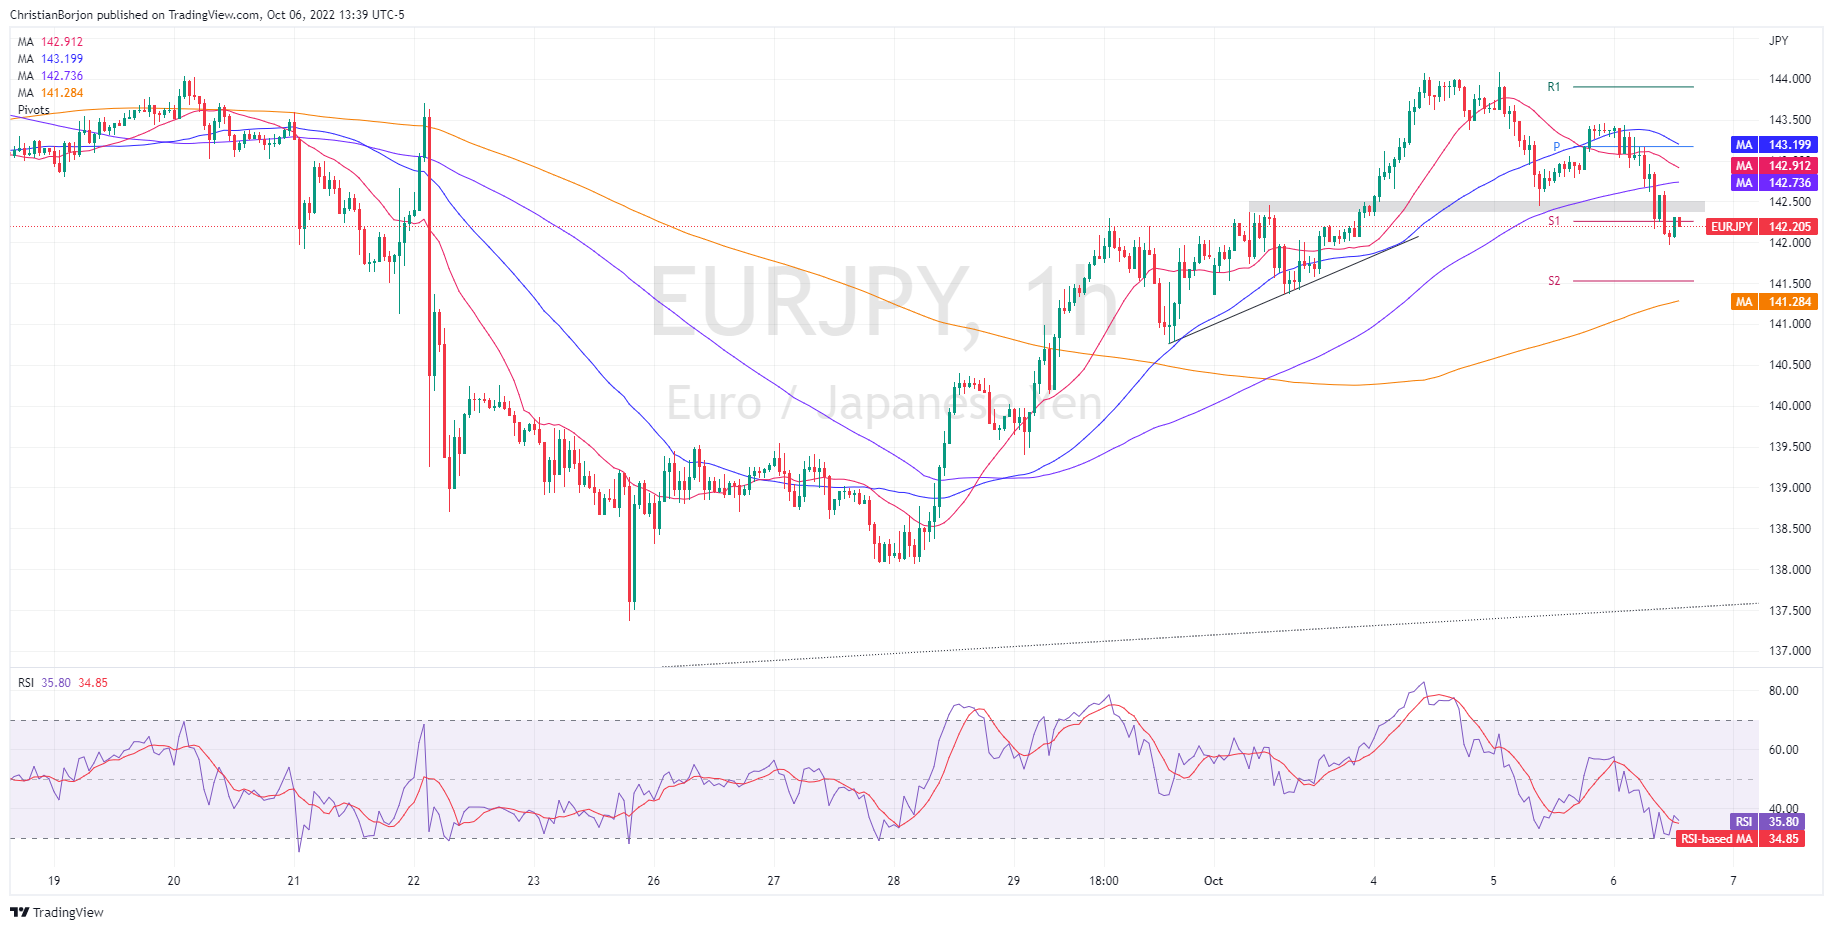
Short term, the EUR/JPY is neutral to downward biased, hoovering around the S1 daily pivot at 142.28. On Thursday, the pair stumbled below the 50, 20, and 100-EMAs, opening the door for further losses, but the fall stalled at 142.00.

Although the cross-currency is downward biased, the Relative Strength Index (RSI) crossed above its 7-RSI’s SMA, meaning buyers are gathering some strength. So a re-test of October 5 daily low at 142.44 is on the cards before continuing downwards.

If that scenario plays out, the EUR/JPY first support would be 142.00. Break below will expose the S2 daily pivot at 141.50, ahead of the next demand zone, and the 200-EMA at 141.28, followed by the 141.00 figure.

EUR/JPY Hourly Chart

EUR/JPY Key Technical Levels

EUR/JPY

Overview
Today last price 142.22
Today Daily Change -0.79
Today Daily Change % -0.55
Today daily open 143.01
 
Trends
Daily SMA20 142.21
Daily SMA50 139.45
Daily SMA100 139.66
Daily SMA200 136.07
 
Levels
Previous Daily High 144.09
Previous Daily Low 142.44
Previous Weekly High 142.29
Previous Weekly Low 137.38
Previous Monthly High 145.64
Previous Monthly Low 137.38
Daily Fibonacci 38.2% 143.07
Daily Fibonacci 61.8% 143.46
Daily Pivot Point S1 142.27
Daily Pivot Point S2 141.53
Daily Pivot Point S3 140.62
Daily Pivot Point R1 143.92
Daily Pivot Point R2 144.83
Daily Pivot Point R3 145.57


Share: Feed news

Information on these pages contains forward-looking statements that involve risks and uncertainties. Markets and instruments profiled on this page are for informational purposes only and should not in any way come across as a recommendation to buy or sell in these assets. You should do your own thorough research before making any investment decisions. FXStreet does not in any way guarantee that this information is free from mistakes, errors, or material misstatements. It also does not guarantee that this information is of a timely nature. Investing in Open Markets involves a great deal of risk, including the loss of all or a portion of your investment, as well as emotional distress. All risks, losses and costs associated with investing, including total loss of principal, are your responsibility. The views and opinions expressed in this article are those of the authors and do not necessarily reflect the official policy or position of FXStreet nor its advertisers. The author will not be held responsible for information that is found at the end of links posted on this page.

If not otherwise explicitly mentioned in the body of the article, at the time of writing, the author has no position in any stock mentioned in this article and no business relationship with any company mentioned. The author has not received compensation for writing this article, other than from FXStreet.

FXStreet and the author do not provide personalized recommendations. The author makes no representations as to the accuracy, completeness, or suitability of this information. FXStreet and the author will not be liable for any errors, omissions or any losses, injuries or damages arising from this information and its display or use. Errors and omissions excepted.

The author and FXStreet are not registered investment advisors and nothing in this article is intended to be investment advice.

Recommended content


Recommended content

Editors’ Picks

EUR/USD clings to daily gains above 1.0650

EUR/USD clings to daily gains above 1.0650

EUR/USD gained traction and turned positive on the day above 1.0650. The improvement seen in risk mood following the earlier flight to safety weighs on the US Dollar ahead of the weekend and helps the pair push higher.

EUR/USD News

GBP/USD recovers toward 1.2450 after UK Retail Sales data

GBP/USD recovers toward 1.2450 after UK Retail Sales data

GBP/USD reversed its direction and advanced to the 1.2450 area after touching a fresh multi-month low below 1.2400 in the Asian session. The positive shift seen in risk mood on easing fears over a deepening Iran-Israel conflict supports the pair.

GBP/USD News

Gold holds steady at around $2,380 following earlier spike

Gold holds steady at around $2,380 following earlier spike

Gold stabilized near $2,380 after spiking above $2,400 with the immediate reaction to reports of Israel striking Iran. Meanwhile, the pullback seen in the US Treasury bond yields helps XAU/USD hold its ground.

Gold News

Bitcoin Weekly Forecast: BTC post-halving rally could be partially priced in Premium

Bitcoin Weekly Forecast: BTC post-halving rally could be partially priced in

Bitcoin price shows no signs of directional bias while it holds above  $60,000. The fourth BTC halving is partially priced in, according to Deutsche Bank’s research. 

Read more

Week ahead – US GDP and BoJ decision on top of next week’s agenda

Week ahead – US GDP and BoJ decision on top of next week’s agenda

US GDP, core PCE and PMIs the next tests for the Dollar. Investors await BoJ for guidance about next rate hike. EU and UK PMIs, as well as Australian CPIs also on tap.

Read more

Forex MAJORS

Cryptocurrencies

Signatures