|

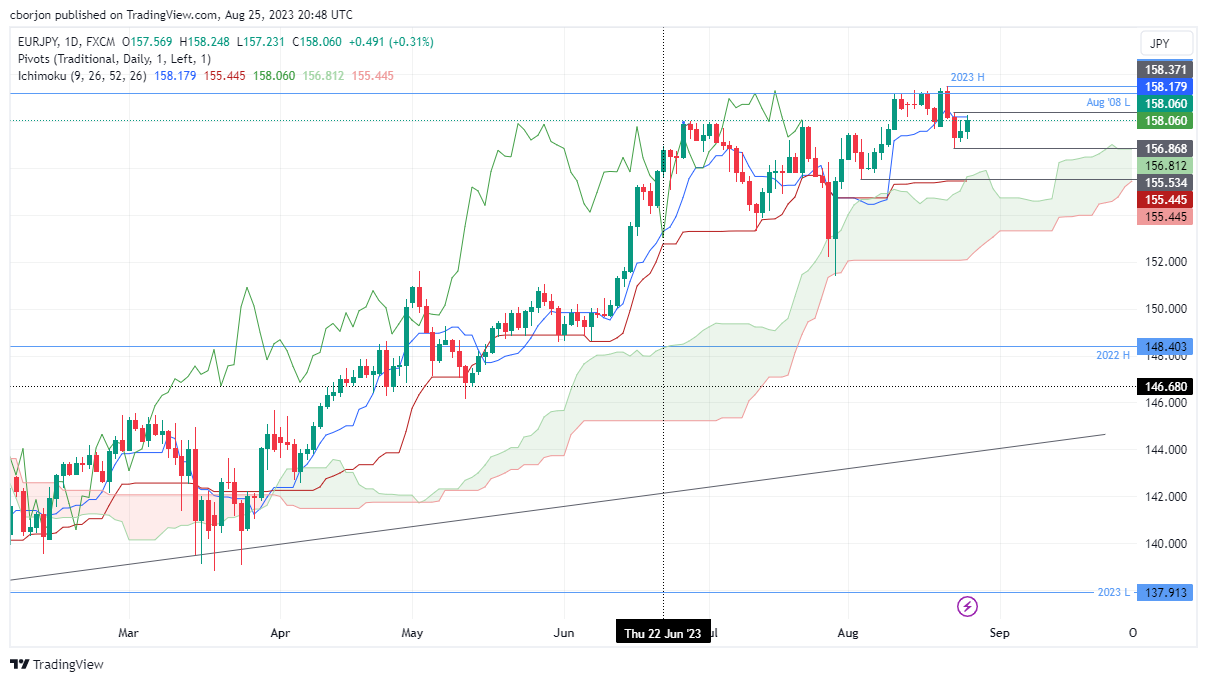
EUR/JPY Price Analysis: Advances and faces strong resistance at Tenkan-Sen, clings to 158.00

  • EUR/JPY consolidates within the 157.00/158.50 range, with an upward bias influenced by ECB President Christine Lagarde’s hawkish tone on inflation.
  • Technical indicators suggest a new trading range could form if the pair falls below 157.00, with key levels at August 3 low of 155.53 and August 23 low of 156.87.
  • A breach above the Tenkan-Sen line at 158.18 could open the door for bulls, targeting the year-to-date high of 159.49, while a break below 158.00 may trigger a slide towards 157.00.

As the New York session closes, the Euro (EUR) recovers some ground against the Japanese Yen (JPY) after neutral to hawkish remarks by the European Central Bank (ECB) President Christine Lagarde emphasized the ECB’s commitment to inflation. Hence, the EUR/JPY pair resumes its uptrend, set to finish Friday’s session with gains of 0.31%.

EUR/JPY Price Analysis: Technical outlook

The EUR/JPY daily chart remains upward biased but is set to finish the week almost flat as the pair consolidates within the 157.00/158.50 area. Should be said that Friday’s uptrend was capped by the Tenkan-Sen line at 158.18, opening the door for a new trading range if the cross tumbles below 157.00. In that event, the pair’s new trading range would be the August 3 low at 155.53 and the August 23 low at 156.87.

Upside risks would emerge if the cross breaches 158.18. Once cleared, bulls would regain control, setting their eyes in the next target, the year-to-date (YTD) high at 159.49. Conversely, if sellers stepped in, achieving a decisive break below 158.00 could exacerbate a drop toward the 157.00 mark, followed by the August 23 low of 156.86.

EUR/JPY Price Action – Daily chart
EUR/JPY

Overview
Today last price158.05
Today Daily Change0.38
Today Daily Change %0.24
Today daily open157.67
 
Trends
Daily SMA20157.69
Daily SMA50156.74
Daily SMA100152.71
Daily SMA200147.61
 
Levels
Previous Daily High158.05
Previous Daily Low157.11
Previous Weekly High159.34
Previous Weekly Low157.66
Previous Monthly High158.05
Previous Monthly Low151.41
Daily Fibonacci 38.2%157.69
Daily Fibonacci 61.8%157.47
Daily Pivot Point S1157.17
Daily Pivot Point S2156.67
Daily Pivot Point S3156.23
Daily Pivot Point R1158.11
Daily Pivot Point R2158.54
Daily Pivot Point R3159.04

Author

Christian Borjon Valencia

Markets analyst, news editor, and trading instructor with over 14 years of experience across FX, commodities, US equity indices, and global macro markets.


More from Christian Borjon Valencia
Share:

Editor's Picks

GBP/USD turns negative; slips back to 1.3530

GBP/USD comes under pressure and weakens toward the 1.3530 zone on Tuesday. Cable thus leaves behind two daily upticks in a row and retreats further from Monday’s multi-week tops past 1.3570 following humble gains in the Greenback and disheartening UK jobs data.

EUR/USD comes under pressure near 1.1570

EUR/USD could not sustain the earlier bullish attempt toward the proximity of 1.1600 the figure, coming under fresh downside pressure and revisiting the 1.1580-1.1570 band as the NA session draws to a close on Tuesday. The better tone in the US Dollar in the latter part of the day weighs on the pair amid steady volatility in the Middle East. Looking forward, the release of the FOMC Minutes takes centre stage on Wednesday.

Gold remains offered around $4,350

Gold accelerates its daily correction and revisits the $4,350 zone per troy ounce on Tuesday. The precious metal sets aside two daily advances in a row and follows the absence of direction in the US Dollar, declining US Treasury yields across the curve and continuous uncertainty in the Middle East crisis.

HYPE extends gains as Hyperliquid urges SEC action on pre-IPO futures framework
Hyperliquid (HYPE) retains a broad bullish outlook, trading above $59.00 on Tuesday. The decentralized exchange (DEX) native token marks the second consecutive day of gains as bulls return, eyeing a short-term breakout above $60.00.
Fiscal concerns and doubts on Fed independence send US yields to long-term highs

US Treasury yields keep rising across the curve this week, with the yield for the 30-year Treasury bond reaching its highest level since 2007, during the global financial crisis, at 5.33% so far on Monday. A mix of concerns about the ballooning US fiscal deficit and growing doubts about the Federal Reserve’s Independence are increasing pressure on US Government Bonds.

Why is Crude Oil priced for a reopening the ships haven't made?
Fourteen vessels crossed the Strait of Hormuz on Tuesday. Before the war, the count ran near 120 a day. In the sessions since the waterway was publicly declared open, Brent has drifted back to $87 and West Texas Intermediate (WTI) to $81, both a little lower again on Wednesday, with daily momentum on each unwound from the top of its range in late July to the low twenties now.














