EUR/GBP Technical Analysis: Euro enjoys a Friday pop to 0.8970 resistance

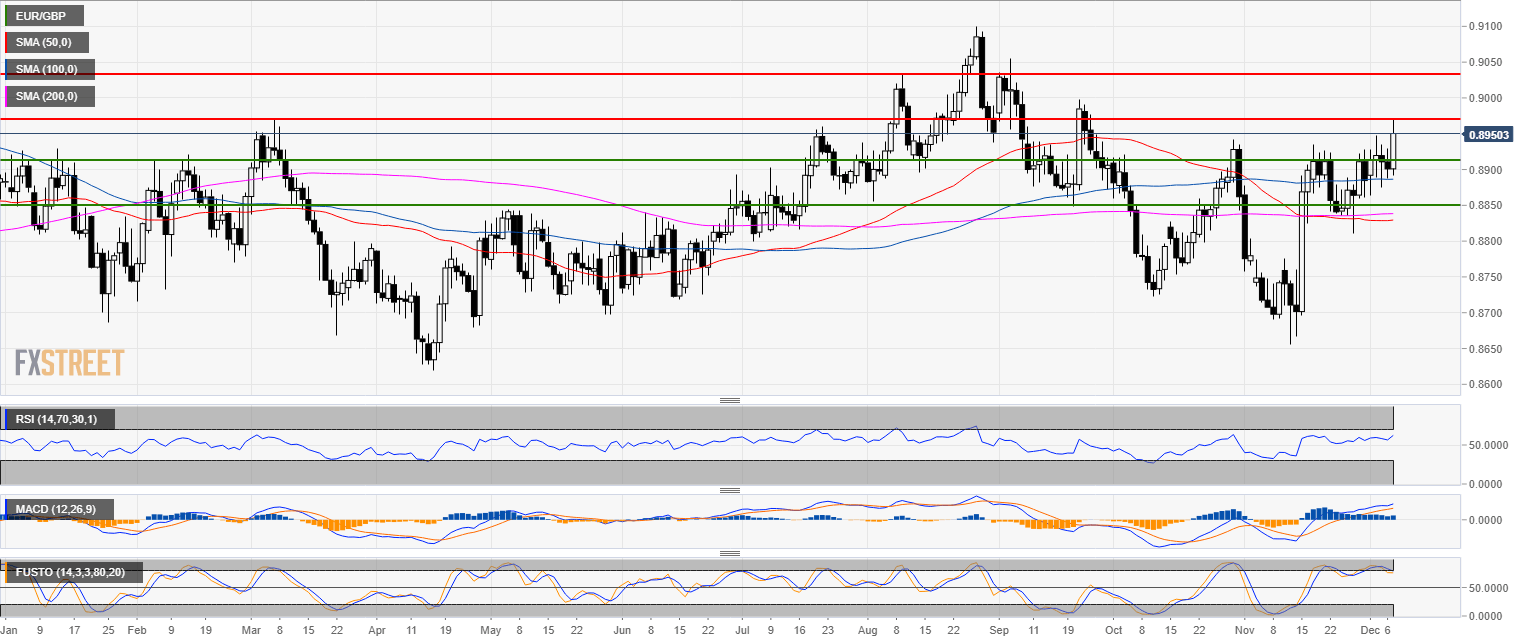
EUR/GBP daily chart
- EUR/GBP is trading in a bull trend above a flat 200-day simple moving average.
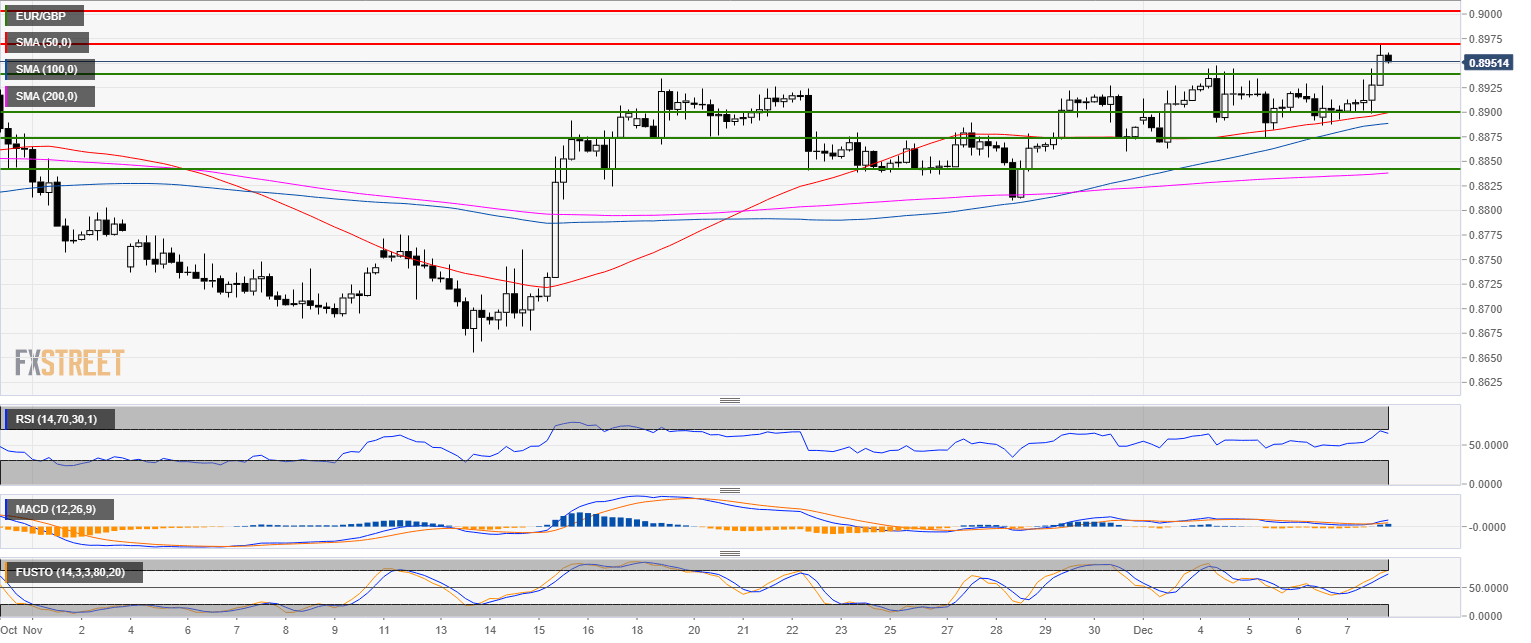
EUR/GBP 4-hour chart
- EUR/GBP reached the 0.8970 resistance.
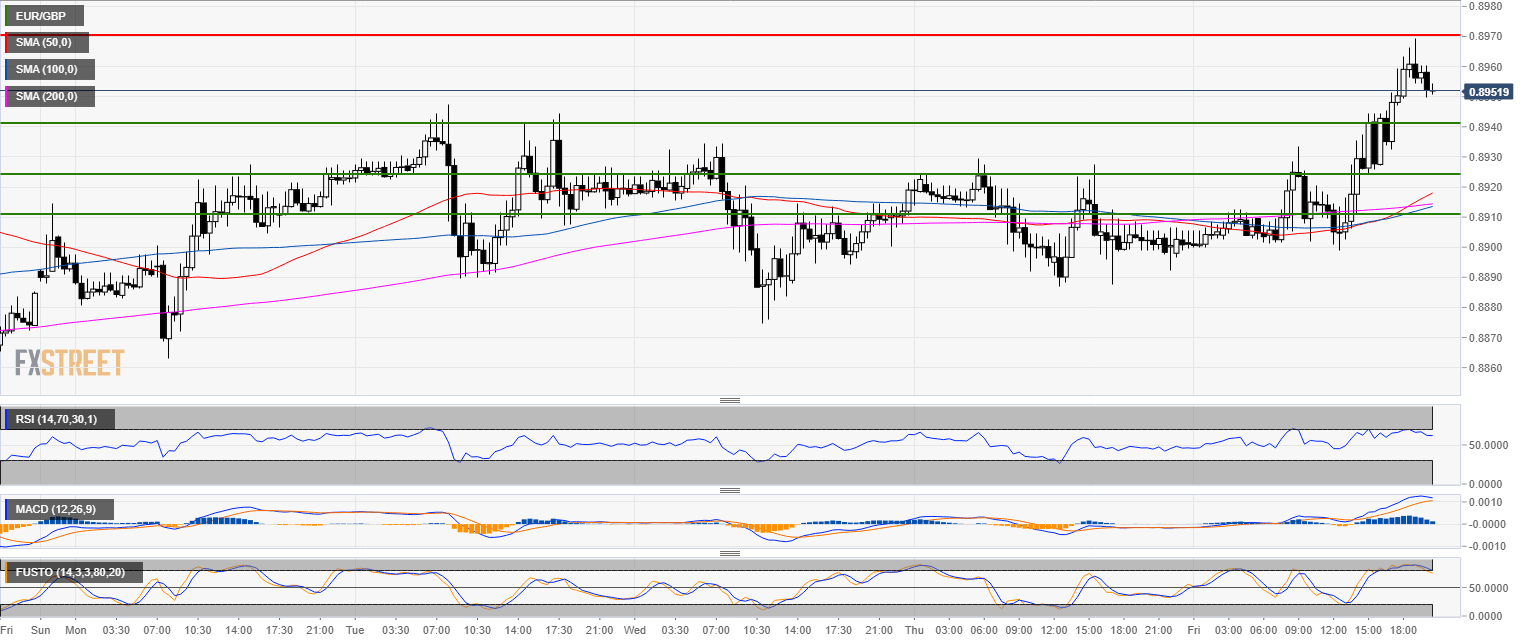
EUR/GBP 30-minute chart
- EUR/GBP had a small Friday bull run to 0.8970 resistance.
- As technical indicators are overbought, the move up might retrace back down to 0.8940, 0.8923 and 0.8910 levels before the uptrend resumes.
Additional key levels
EUR/GBP
Overview:
Today Last Price: 0.8952
Today Daily change: 51 pips
Today Daily change %: 0.573%
Today Daily Open: 0.8901
Trends:
Previous Daily SMA20: 0.8855
Previous Daily SMA50: 0.8829
Previous Daily SMA100: 0.8886
Previous Daily SMA200: 0.8839
Levels:
Previous Daily High: 0.893
Previous Daily Low: 0.8887
Previous Weekly High: 0.8926
Previous Weekly Low: 0.881
Previous Monthly High: 0.8932
Previous Monthly Low: 0.8656
Previous Daily Fibonacci 38.2%: 0.8904
Previous Daily Fibonacci 61.8%: 0.8914
Previous Daily Pivot Point S1: 0.8882
Previous Daily Pivot Point S2: 0.8863
Previous Daily Pivot Point S3: 0.8838
Previous Daily Pivot Point R1: 0.8925
Previous Daily Pivot Point R2: 0.895
Previous Daily Pivot Point R3: 0.8969
Author

Flavio Tosti
Independent Analyst


