|

EUR/CAD Price Analysis: Bears rejected pair at 20-day and 200-day SMA convergence

  • EUR/CAD shed 0.30% on Thursday to trade near 1.4770.
  • The cross faced rejection at the 20-day and 200-day SMA convergence at around 1.4800, completing a bearish crossover.
  • The bearish crossover tends to be bearish sign, hinting at further weakness in the pair.

The EUR/CAD fell by 0.30% on Thursday, reaching approximately 1.4770. The convergence of the 20-day and 200-day Simple Moving Averages (SMAs) around 1.4800 was rejected the cross, which resulted in a bearish crossover. This bearish crossover may suggest more weakness in the pair.

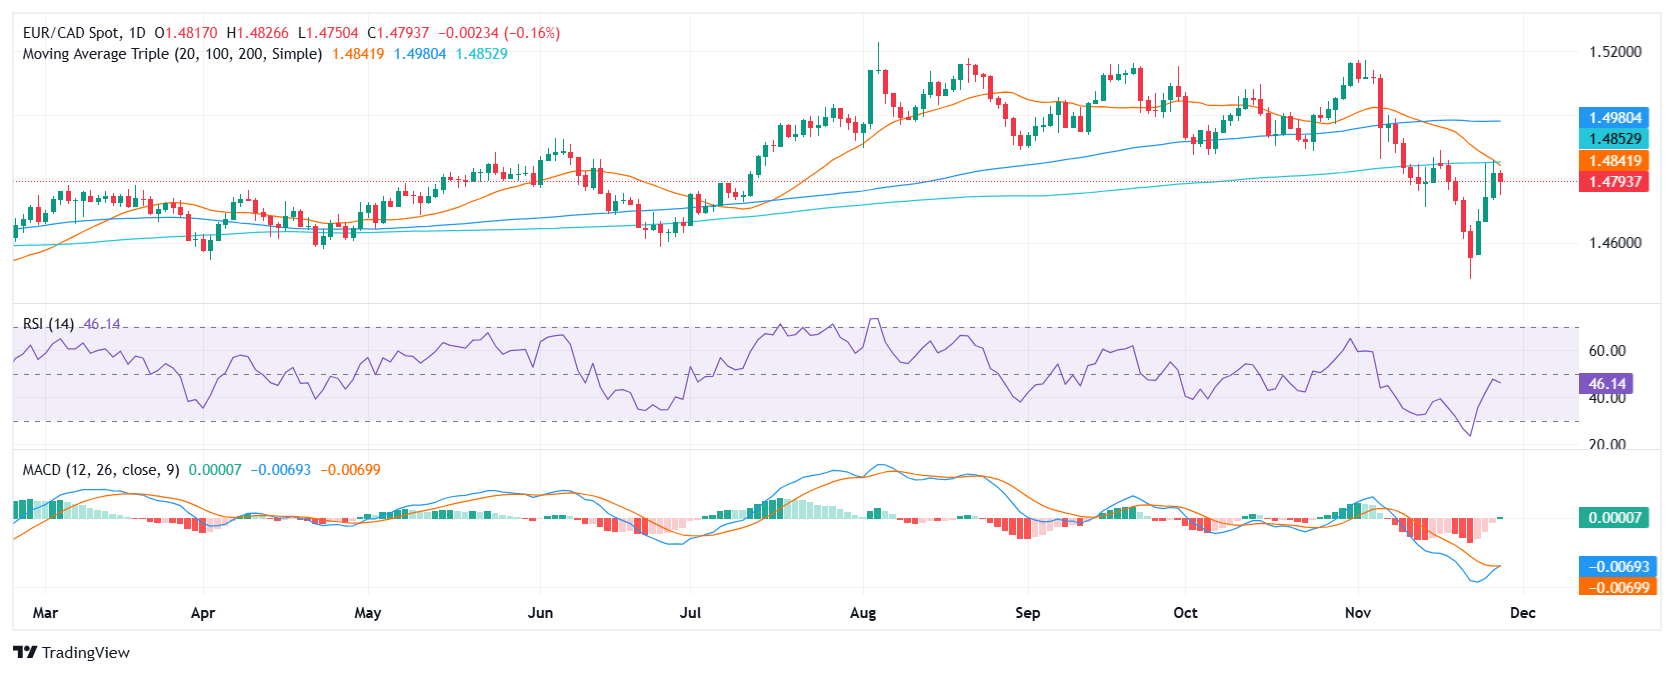
Technical indicators, such as the Relative Strength Index (RSI) and the Moving Average Convergence Divergence (MACD), substantiate the bearish momentum in EUR/CAD's recent price action. The RSI, currently in negative territory, shows increasing selling pressure with a declining slope, suggesting a rise in bearish sentiment. Meanwhile, the MACD, though flat, remains in red, indicating sustained selling pressure.

The EUR/CAD pair has been facing strong resistance at the confluence of its 20-day and 200-day SMAs, leading to a bearish crossover. This signals potential weakness in the pair in the coming sessions as it may invalidate it latest strides to recover.

EUR/CAD daily chart

Author

Patricio Martín

Patricio is an economist from Argentina passionate about global finance and understanding the daily movements of the markets.

More from Patricio Martín
Share:

Editor's Picks

EUR/USD appears supported by the 200-day SMA, for now

Following an early pullback to multi-week lows near 1.1670, EUR/USD now manages to reclaim the 1.1700 region as the NA session draws to a close on Monday. The steep retracement in spot follows the equally strong move higher in the US Dollar, as investors continue to assess the geopolitical landscape in the wake of the US and Israel attacks on Iran.


GBP/USD hits new yearly lows near 1.3300

GBP/USD adds to the recent bearish tone, approaching to the key 1.3300 support to reach fresh YTD troughs against the backdrop of the robust performance of the US Dollar. Indeed, Cable’s decline comes amid the firm demand for the safe-haven space in the wake of the US and Israel attacks to Iran.

Gold eases some ground, approaches $5,300

Gold now surrenders part of the earlier advance, reshifting its attenton to the $5,300 zone per troy ounce at the beginning of the week. Indeed, the yellow metal’s firm performance appears propped up by incresing geopolitical jitters in the Middle East, which at the same time fuels the demand for the safe-haven space.

Ethereum Price Forecast: BitMine lifts ETH holdings to 4.47M, Lee predicts geopolitical impact on markets

Ethereum (ETH) treasury firm BitMine Immersion (BMNR) bought another 50,928 ETH last week, sending its stash of the top altcoin to 4.47 million ETH worth about $8.9 billion at the time of publication.

The Fed is finally talking about AI – Here's why it matters for the US Dollar

AI is moving from earnings calls into the heart of monetary policy discussions, forcing Federal Reserve officials to confront a new question: How to act if AI reshapes inflation, employment and interest rates at the same time?

Grass 20% bullish breakout defies broader market weakness

Grass (GRASS) is edging up above $0.30 at the time of writing on Monday. The token’s notable 20% intraday surge stands out amid heightened volatility in the broader crypto market.