|

Elliott Wave expects Nvidia to extend impulsive rally [Video]

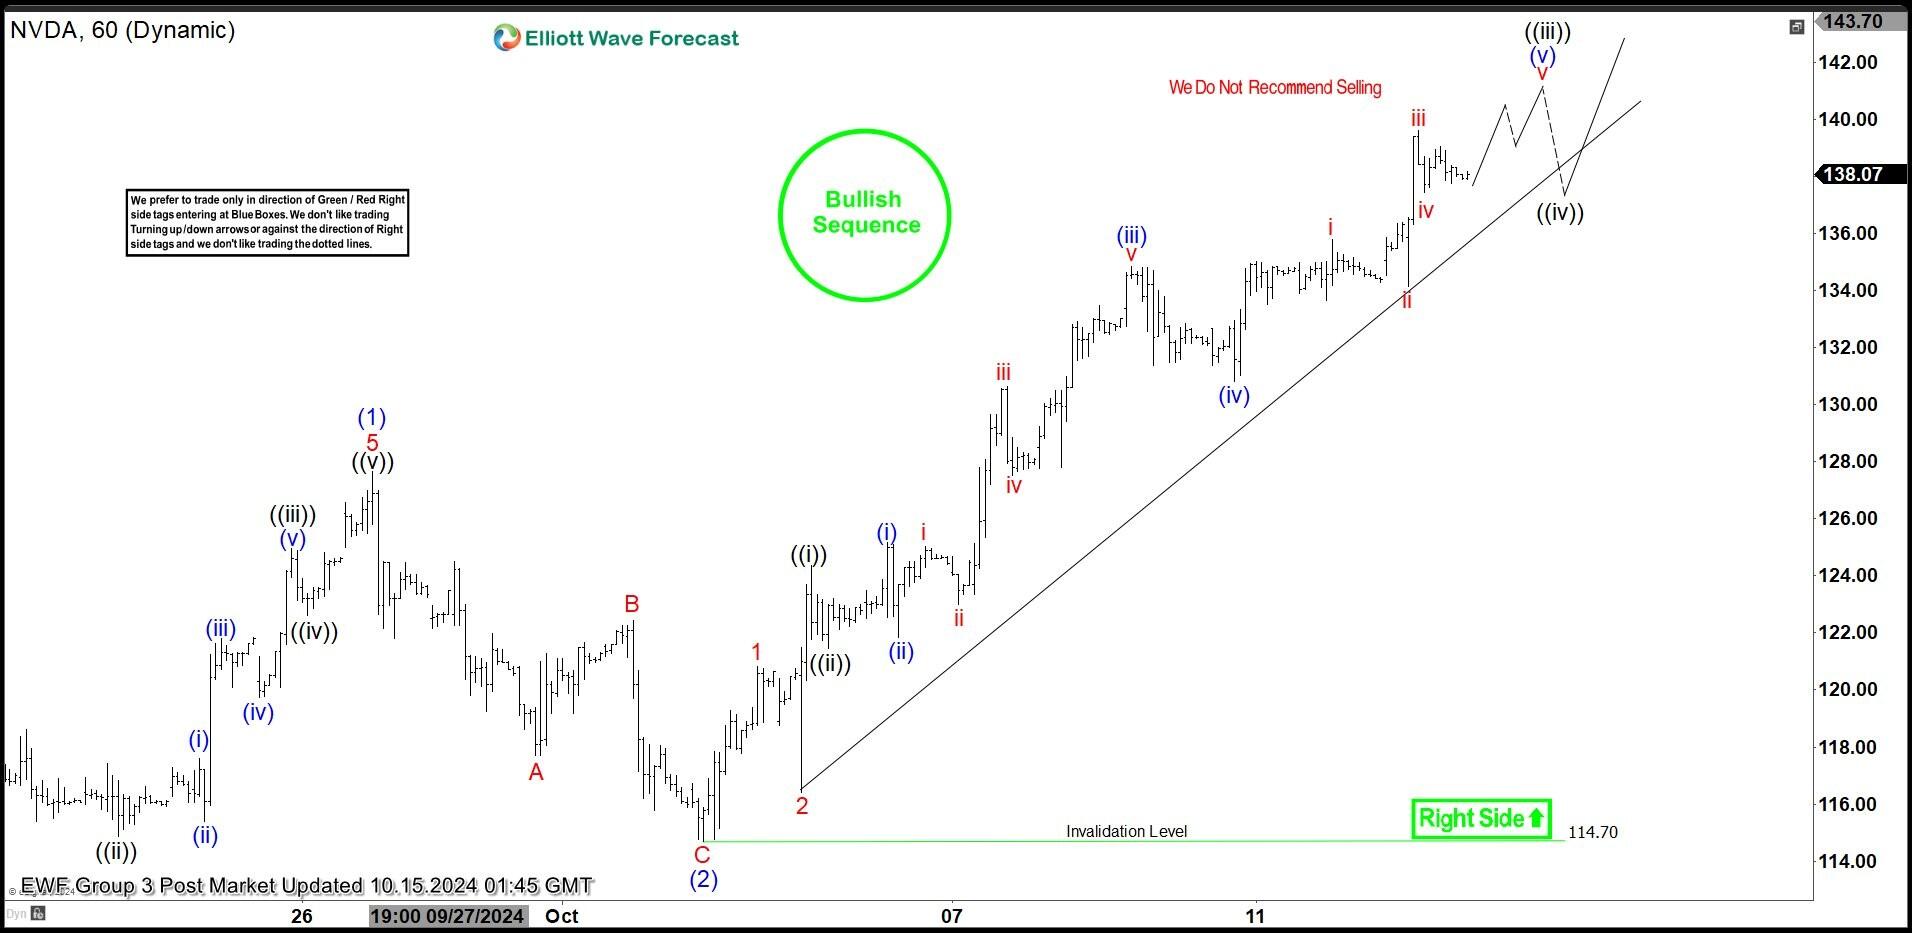
Short Term Elliott Wave View in Nvidia (NVDA) suggests that cycle from 9.6.2024 low is in progress as a 5 waves impulse. Up from 9.6.2024 low, wave (1) ended at 127.67. Dips in wave (2) ended at 114.7 as the 1 hour chart below shows. Internal subdivision of wave (2) unfolded as a zigzag Elliott Wave structure. Down from wave (1), wave A ended at 117.72 and wave B ended at 122.44. Wave C lower ended at 114.7 which completed wave (2) in higher degree. The stock has resumed higher in wave (3). Potential target for wave (3) is 100% – 161.8% Fibonacci extension of wave (1). This area comes at 142.2 – 158.6 area.

Up from wave (2), wave 1 ended at 120.83 and wave 2 ended at 116.42. The stock then nested higher with wave ((i)) ended at 124.36 and pullback in wave ((ii)) ended at 121.46. Expect the stock to extend higher to complete wave ((iii)), then it should pullback in wave ((iv)) before it resumes higher again in wave ((v)) of 3. Near term, as far as pivot at 114.7 low stays intact, expect dips to find support in 3, 7, or 11 swing for further upside.

Nvidia 60 minutes Elliott Wave chart

Chart

NVDA Elliott Wave [Video]

Author

Elliott Wave Forecast Team

Elliott Wave Forecast Team

ElliottWave-Forecast.com

More from Elliott Wave Forecast Team
Share:

Markets move fast. We move first.

Orange Juice Newsletter brings you expert driven insights - not headlines. Every day on your inbox.

By subscribing you agree to our Terms and conditions.

Editor's Picks

EUR/USD edges higher to mid-1.1600s; looks to US PCE Price Index for fresh impetus

The EUR/USD pair attracts some dip-buyers during the Asian session on Friday and recovers a part of the previous day's retracement slide from the 1.1680 region, or the highest level since October 17. Spot prices currently trade around mid-1.1600s and remain on track to register gains for the second straight week.

GBP/USD: Constructive view prevails above 1.3300 ahead of US PCE inflation data

The GBP/USD pair trades on a flat note near 1.3330 during the Asian trading hours on Friday. Traders prefer to wait on the sidelines ahead of the key US inflation report later on Friday. The US delayed Personal Consumption Expenditures Price Index report for September could offer some hints about the US interest rate path.

Gold edges higher amid dovish Fed expectations; traders await US PCE inflation data

Gold struggles to capitalize on the overnight bounce from the $4,175 area, or the vicinity of the weekly trough, and oscillates in a narrow trading range during the Asian session on Friday. Traders now seem reluctant and opt to move to the sidelines ahead of the September Personal Consumption Expenditures Price Index, or the Federal Reserve's preferred inflation gauge. 

Pi Network: Bearish streak nears critical support trendline

Pi Network edges lower on Friday for the third consecutive day, approaching a local support trendline. The on-chain data suggests an increase in supply pressure as Centralized Exchanges experience a surge in inflows. Technically, the pullback in PI risks further losses, as the Moving Average Convergence Divergence indicator is flashing a sell signal. 

Why the Fed may cut rates in December: Understanding the policy shift

The Fed has gone through a noticeable policy swing in recent months - from initiating a rate cut, to signaling a potential pause, and now shifting once again toward another cut in December. This has created understandable confusion among traders and investors trying to interpret the Fed’s reaction function.

XRP edges lower despite record on-chain activity and steady ETF inflows

Ripple is trading under pressure at the time of writing on Thursday, after bulls failed to break the short-term resistance at $2.22. The reversal may extend toward Monday’s low of $1.98, especially if risk-off sentiment persists in the broader cryptocurrency market.