|

Elliott Wave analysis: Tesla (TSLA) looking for double correction [Video]

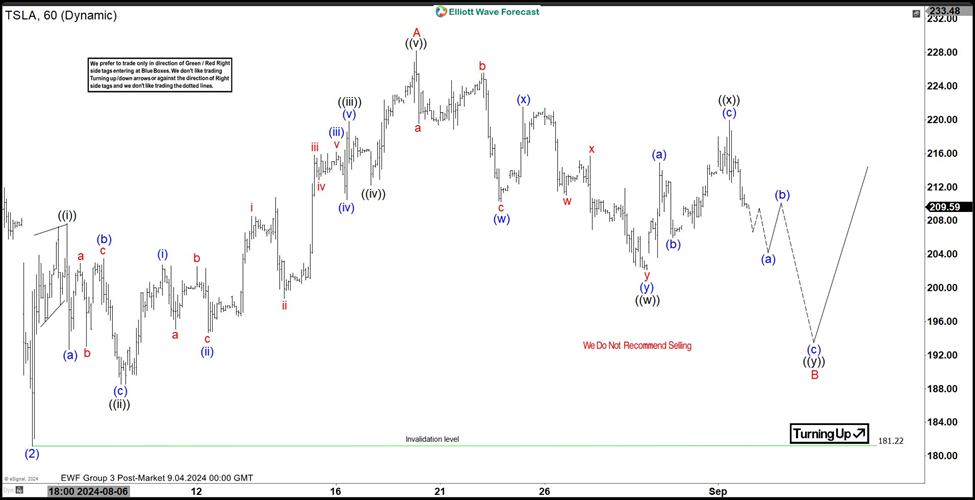
Short Term Elliott Wave in Tesla (TSLA) suggests that rally from 4.22.2024 low is in progress as a 5 waves leading diagonal. The internal subdivision of this diagonal is in 3-3-3-3-3. Up from 4.22.2024 low, wave (1) ended at 271 and pullback in wave (2) ended at 181.22. The stock has turned higher in wave (3) with internal subdivision as a 3 waves zigzag structure. Up from wave (2), wave ((i)) ended at 207.65 and dips in wave ((ii)) ended at 188.50. The stock resumed higher in wave ((iii)) towards 219.80 and pullback in wave ((iv)) ended at 212.21. Final leg wave ((v)) ended at 228.22 which completed wave A in higher degree.

Pullback in wave B is in progress to correct cycle from 8.5.2024 low with internal subdivision as a double three. Down from wave A, wave (w) ended at 210.2 and wave (x) ended at 221.48. Wave (y) lower ended at 202.13 which completed wave ((w)) in higher degree. Wave ((x)) rally ended at 219.90. Expect the stock to resume lower in wave ((y)) towards 181 – 194 area to complete wave B pullback before the stock turns higher. Near term, as far as pivot at 181.22 low is intact, expect pullback to find support in 3, 7, 11 swing for further upside.

Tesla (TSLA) 60 minutes Elliott Wave chart

TSLA Elliott Wave [Video]

Author

Elliott Wave Forecast Team

Elliott Wave Forecast Team

ElliottWave-Forecast.com

More from Elliott Wave Forecast Team
Share:

Editor's Picks

EUR/USD tests nine-day EMA support near 1.1850

EUR/USD remains in the negative territory for the fourth successive session, trading around 1.1870 during the Asian hours on Friday. The 14-day Relative Strength Index momentum indicator at 56 stays above the midline, confirming steady momentum. RSI has eased but remains above 50, indicating momentum remains constructive for the bulls.

GBP/USD consolidates around 1.3600 vs. USD; looks to US CPI for fresh impetus

The GBP/USD pair remains on the defensive through the Asian session on Friday, though it lacks bearish conviction and holds above the 1.3600 mark as traders await the release of the US consumer inflation figures before placing directional bets.

Gold recovers swiftly from weekly low, climbs back closer to $5,000 ahead of US CPI

Gold regains positive traction during the Asian session on Friday and recovers a part of the previous day's heavy losses to the $4,878-4,877 region, or the weekly low. The commodity has now moved back closer to the $5,000 psychological mark as traders keenly await the release of the US consumer inflation figures for more cues about the Federal Reserve's policy path.

Solana: Mixed market sentiment caps recovery

Solana is trading at $79 as of Friday, following a correction of over 9% so far this week. On-chain and derivatives data indicates mixed sentiment among traders, further limiting the chances of a price recovery.

A tale of two labour markets: Headline strength masks underlying weakness

Undoubtedly, yesterday’s delayed US January jobs report delivered a strong headline – one that surpassed most estimates. However, optimism quickly faded amid sobering benchmark revisions.

Solana Price Forecast: Mixed market sentiment caps recovery

Solana (SOL) is trading at $79 as of Friday, following a correction of over 9% so far this week. On-chain and derivatives data indicates mixed sentiment among traders, further limiting the chances of a price recovery.