Dow Jones Industrial Average gets pummeled by rising Treasury yields
- The Dow Jones fell on Wednesday, shedding 800 points at its lowest and slipping below 42,000.
- Investors have pivoted to concerns about the US federal budget which will send US deficits higher, not lower.
- Market concerns that the Trump administration’s bespoke budget won’t actually do anything to fix inflation or US debt issues sent Treasury yields higher, putting downward pressure on equity markets.

The Dow Jones Industrial Average (DJIA) recoiled on Wednesday, tumbling 800 and testing below 42,000 after demand for United States (US) Treasuries declined. Financial markets are showing waning interest and confidence in US debt financing, even with 20-year Treasury bonds offering a yield north of 5% for the first time since October of 2023. The bid-to-cover on 16B worth of 20-year Treasuries fell below its six-month average of 2.57, slipping to 2.46 and sending market sentiment into a brief tailspin.
The US government inches closer to approving US President Donald Trump’s “big, beautiful budget” that will add almost four trillion dollars to the US deficit over the next decade. The deficit-swelling budget comes less than a week after Moody’s downgraded US sovereign debt, citing long-running failures by the US government to reel in government spending or sufficiently increase tax receipts.
A rate cut, a rate cut, my kingdom for a rate cut!
Investor hopes for another rate cut from the Federal Reserve (Fed) continue to get pushed further out this year. According to Fed policymakers, the looming threat that US tariffs could reignite inflation and throw a wrench in US economic growth is limiting their ability to adjust policy rates as they wait for clear data. The Trump administration is barreling towards the end of its own “reciprocal tariffs” suspension deadline, and evidence of ink-on-paper trade deals remains functionally non-existent. With the future of US trade policy muddying the waters, rate traders are now split on whether the Fed will deliver its first quarter-point rate cut in September or October.
Read more stock news: US stock market slips despite Republicans inching closer to major tax cuts
Dow Jones price forecast
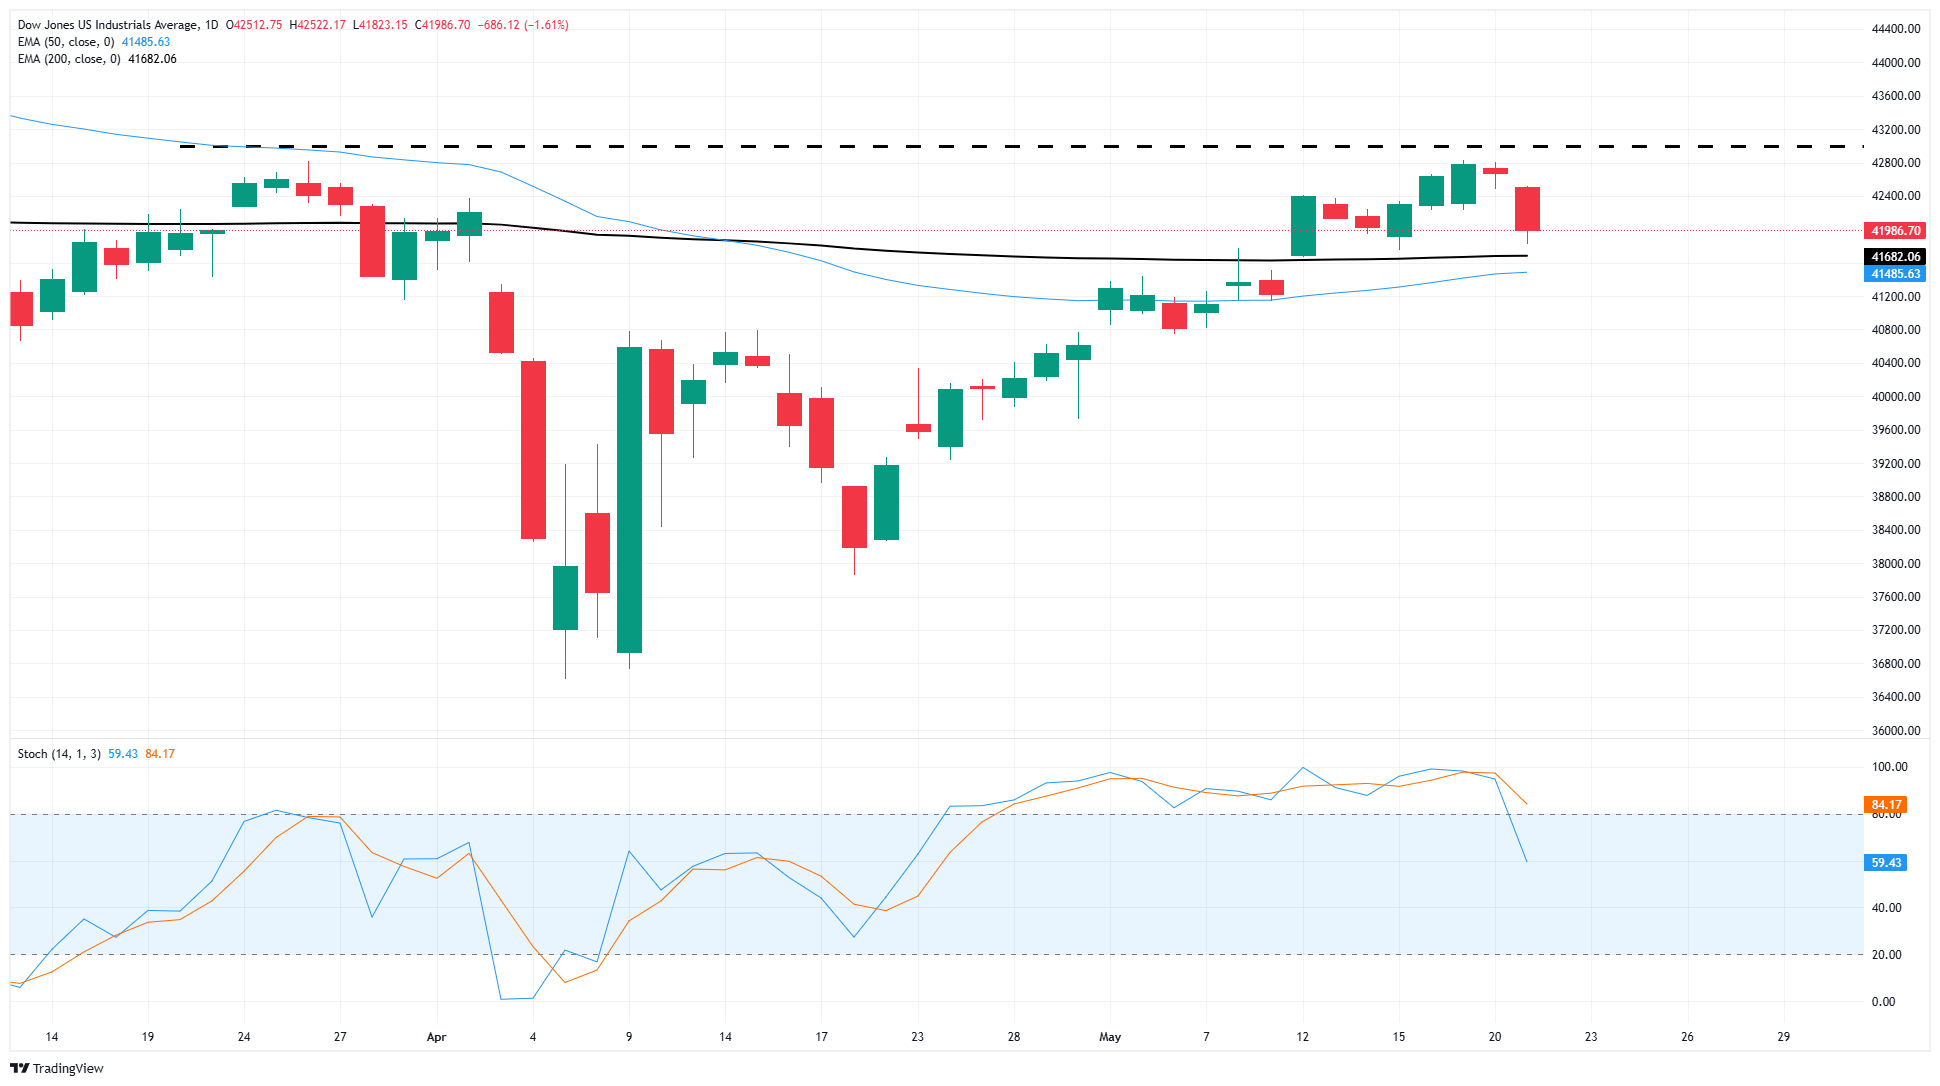
Fundamentals have bled through the chart paper, taking over market dynamics as investors react to headlines about trade and federal budgets. The Dow Jones Industrial Average is still trading above the 200-day Exponential Moving Average (EMA) near 41,570, at least for now. Bullish price action continues to have the wind knocked out of its sails, and buyers have thus far struggled to muscle the major equity index back to the 43,000 handle.
Dow Jones daily chart
Economic Indicator
S&P Global Composite PMI
The S&P Global Composite Purchasing Managers Index (PMI), released on a monthly basis, is a leading indicator gauging US private-business activity in the manufacturing and services sector. The data is derived from surveys to senior executives. Each response is weighted according to the size of the company and its contribution to total manufacturing or services output accounted for by the sub-sector to which that company belongs. Survey responses reflect the change, if any, in the current month compared to the previous month and can anticipate changing trends in official data series such as Gross Domestic Product (GDP), industrial production, employment and inflation. The index varies between 0 and 100, with levels of 50.0 signaling no change over the previous month. A reading above 50 indicates that the private economy is generally expanding, a bullish sign for the US Dollar (USD). Meanwhile, a reading below 50 signals that activity is generally declining, which is seen as bearish for USD.
Read more.Next release: Thu May 22, 2025 13:45 (Prel)
Frequency: Monthly
Consensus: -
Previous: 50.6
Source: S&P Global
Author

Joshua Gibson
FXStreet
Joshua joins the FXStreet team as an Economics and Finance double major from Vancouver Island University with twelve years' experience as an independent trader focusing on technical analysis.