Dow Jones Industrial Average chalks another 300 points on Friday
- The Dow Jones is grinding its way back into record bids on Friday.
- US markets are leaning firmly into bets of a 50 bps cut from the Fed.
- Mixed US sentiment figures keep investor sentiment on the high side.

The Dow Jones Industrial Average rallied for a third straight day on Friday, climbing around 350 points and coming within reach of record highs above 41,500 as market sentiment tilts further into rate cut hopes. According to the CME’s FedWatch Tool, rate traders are pricing in a 45% chance of an initial 50 bps rate cut from the Federal Reserve (Fed) when the US central bank gathers to make its rate decision on September 18.
The University of Michigan’s Consumer Sentiment Index rose to 69.0 in September, reaching a four-month high as surveyed consumers’ outlook on the US economy slowly improves following months of declining economic expectations. The upside tilt in UoM survey results helped to anchor rate cut expectations heading into next week, despite the UoM also noting an uptick in 5-year Consumer Inflation Expectations to 3.1% in September from the previous 3.0%.
US Export and Import Price Indexes also declined sharper than expected in August, with the Export Price Index printing a -0.7% contraction versus the expected -0.1%, reversing the previous month’s 0.5% as inflation pressures appear to ease in trade conditions. The MoM Import Price Index in August contracted 0.3%, below the expected -0.2% and down from the previous period’s 0.1%.
Dow Jones news
With equities leaning firmly into rate cut hopes, the Dow Jones equity index is broadly in the green on Friday, with all but three of the DJIA’s constituent securities on the rise to wrap up the trading week. Gains are being led by Caterpillar Inc (CAT) and Home Depot Inc (HD), with both stocks climbing nearly 2% for the day. Caterpillar is testing above $346 per share while Home Depot is breaking above $381 per share for the first time since March.
Elsewhere on the Dow Jones, Boeing Co (BA) is facing steep declines on Friday, tumbling to a daily performance of -3.5% and falling to $157 per share as the airplane manufacturer sees its first worker strike in over 15 years.
Dow Jones price forecast
The Dow Jones is within a stone’s throw of fresh all-time highs, testing into 41,500 with eyes on late August’s current record high bid of 41,574. The Dow Jones has rallied nearly 4% in the last three days, recovering from a near-term plunge below the 50-day Exponential Moving Average (EMA), catching a technical bounce from 39,989.
Dow Jones daily chart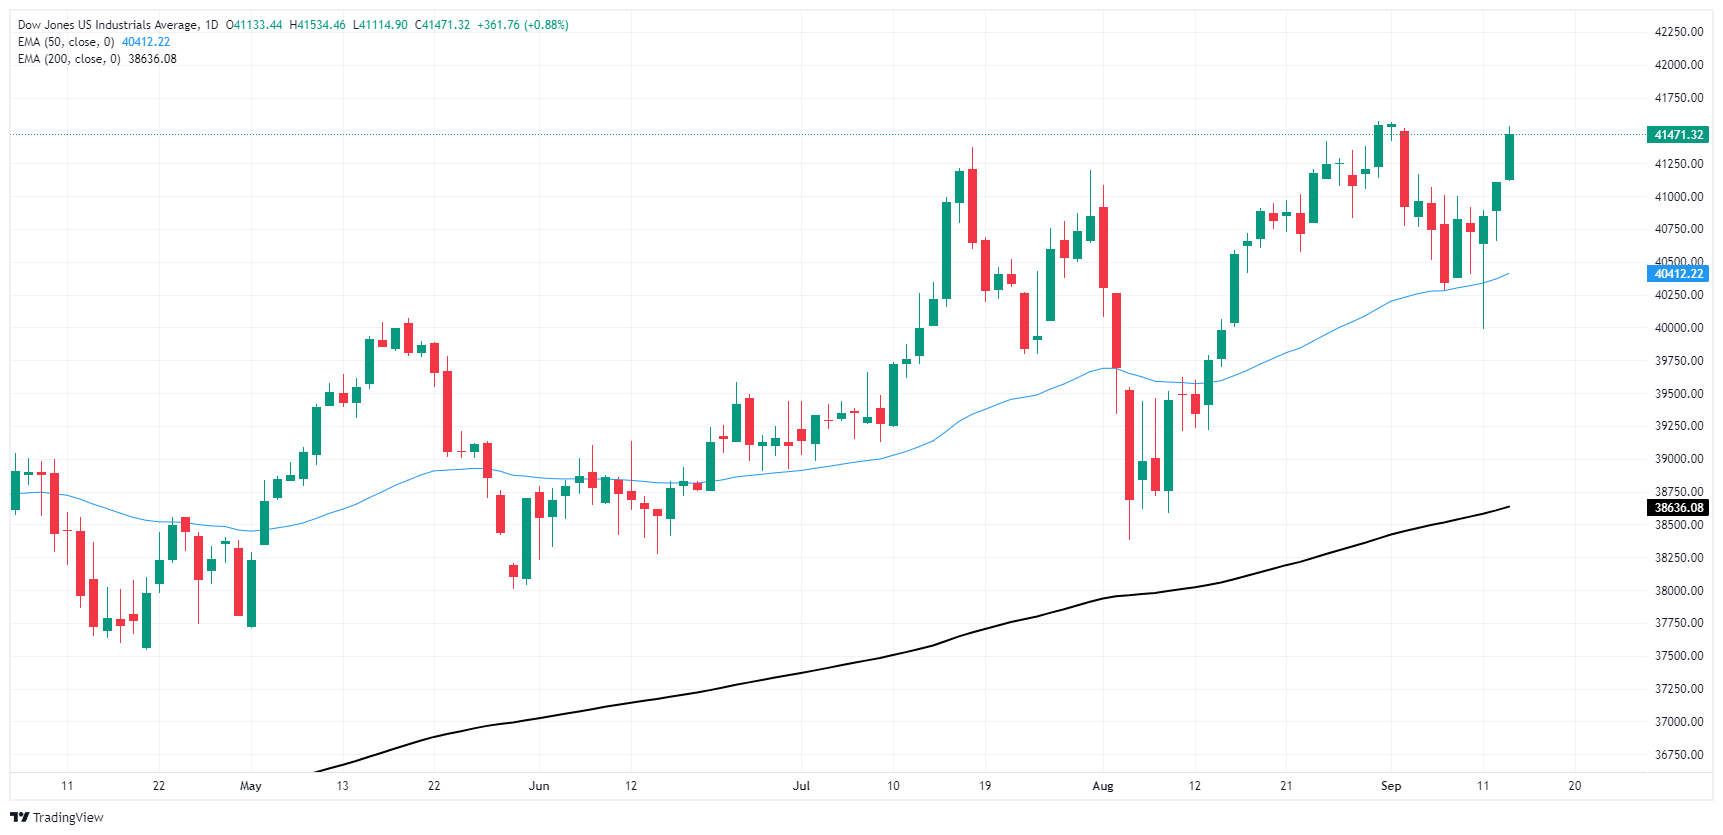
Dow Jones FAQs
The Dow Jones Industrial Average, one of the oldest stock market indices in the world, is compiled of the 30 most traded stocks in the US. The index is price-weighted rather than weighted by capitalization. It is calculated by summing the prices of the constituent stocks and dividing them by a factor, currently 0.152. The index was founded by Charles Dow, who also founded the Wall Street Journal. In later years it has been criticized for not being broadly representative enough because it only tracks 30 conglomerates, unlike broader indices such as the S&P 500.
Many different factors drive the Dow Jones Industrial Average (DJIA). The aggregate performance of the component companies revealed in quarterly company earnings reports is the main one. US and global macroeconomic data also contributes as it impacts on investor sentiment. The level of interest rates, set by the Federal Reserve (Fed), also influences the DJIA as it affects the cost of credit, on which many corporations are heavily reliant. Therefore, inflation can be a major driver as well as other metrics which impact the Fed decisions.
Dow Theory is a method for identifying the primary trend of the stock market developed by Charles Dow. A key step is to compare the direction of the Dow Jones Industrial Average (DJIA) and the Dow Jones Transportation Average (DJTA) and only follow trends where both are moving in the same direction. Volume is a confirmatory criteria. The theory uses elements of peak and trough analysis. Dow’s theory posits three trend phases: accumulation, when smart money starts buying or selling; public participation, when the wider public joins in; and distribution, when the smart money exits.
There are a number of ways to trade the DJIA. One is to use ETFs which allow investors to trade the DJIA as a single security, rather than having to buy shares in all 30 constituent companies. A leading example is the SPDR Dow Jones Industrial Average ETF (DIA). DJIA futures contracts enable traders to speculate on the future value of the index and Options provide the right, but not the obligation, to buy or sell the index at a predetermined price in the future. Mutual funds enable investors to buy a share of a diversified portfolio of DJIA stocks thus providing exposure to the overall index.
Author

Joshua Gibson
FXStreet
Joshua joins the FXStreet team as an Economics and Finance double major from Vancouver Island University with twelve years' experience as an independent trader focusing on technical analysis.


