Dow Jones Industrial Average gains ground on easygoing Friday
- The Dow Jones rose slightly on Friday to close out the week on the high side.
- Equities wrestled with tariffs, earnings and geopolitical headlines this week.
- Indexes recovered their footing after a choppy midweek pullback.

The Dow Jones Industrial Average (DJIA) found a bit of room on the high side on Friday, adding a little over 200 points to close out a back-and-forth week. United States (US) President Donald Trump’s long-awaited tariffs have come into effect, and markets are either bracing for fallout or hoping for another delay, in equal parts.
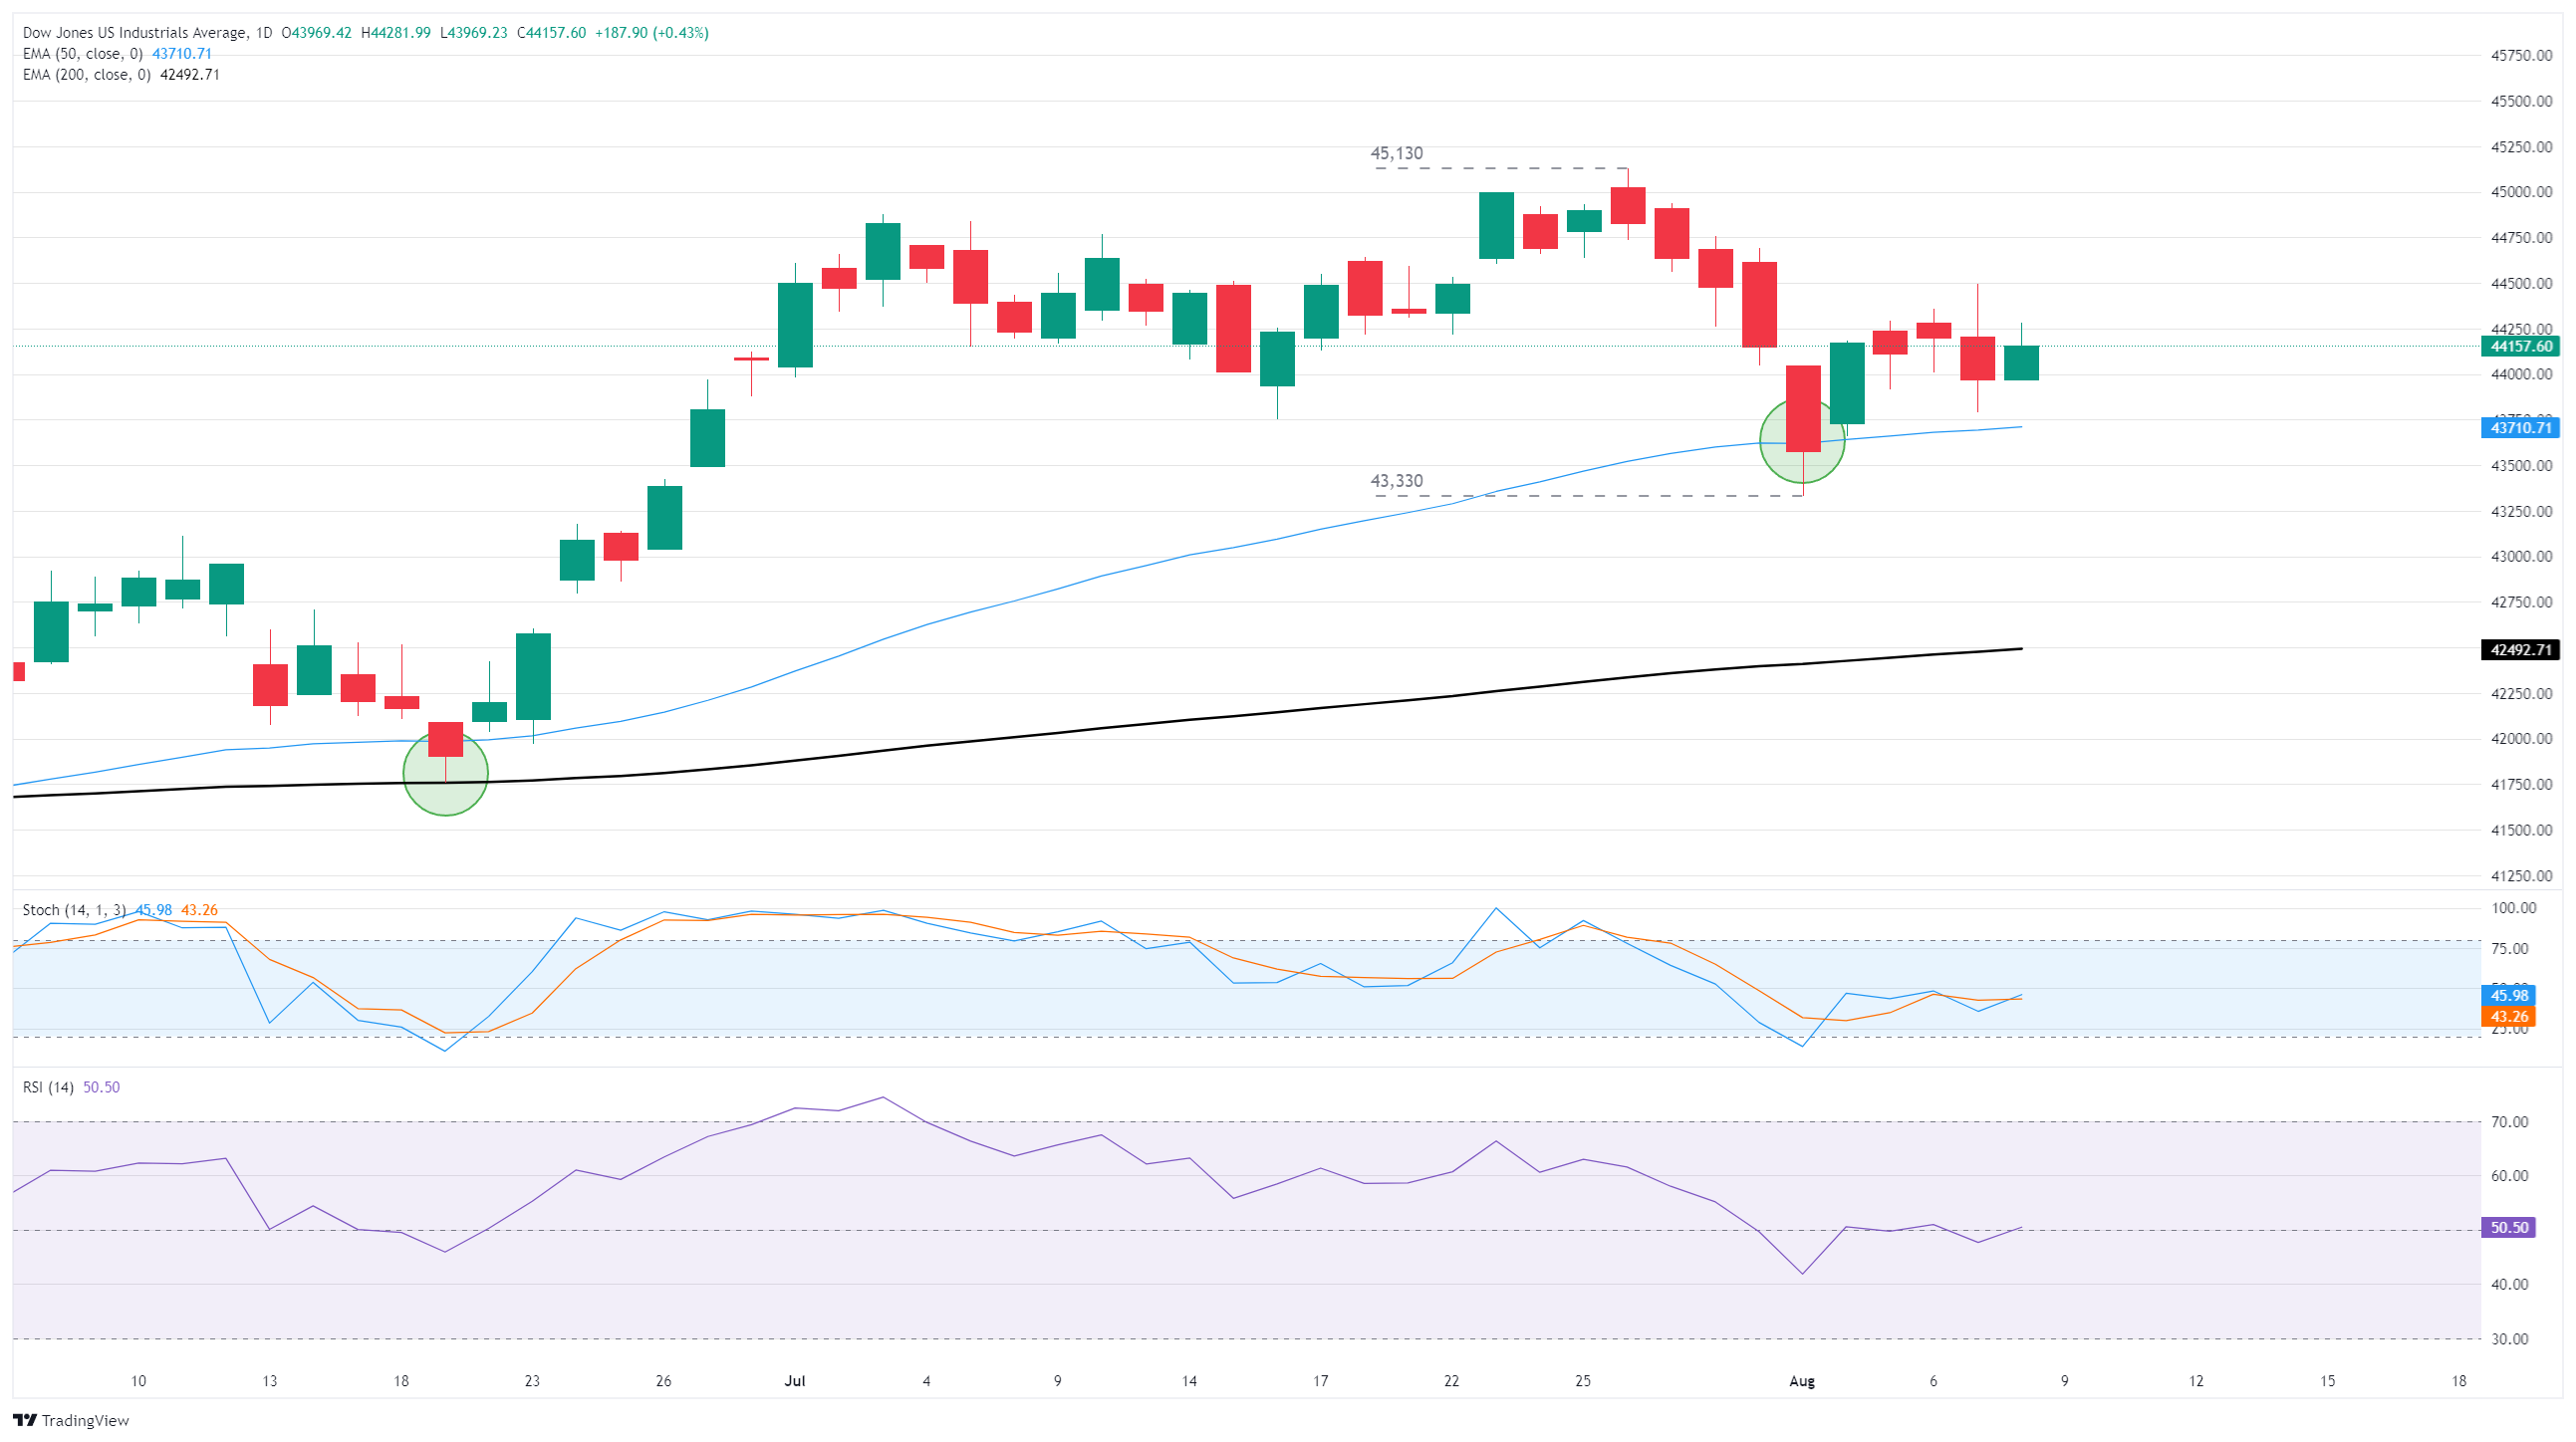
Despite recently tapping record highs near 45,130, the Dow Jones is struggling to maintain firm bullish momentum, with price action trapped near the 44,000 handle. The Dow is still finding a technical floor near the 50-day Exponential Moving Average (EMA), currently drifting above 43,700, but the next leg could land in either direction with the Relative Strength Index (RSI) stuck in the middle near 50.00.
Tariffs on... again?
With the Trump tariffs now in play, investors will be watching to see how the US’s newfound trade policy stance will play out. President Trump has threatened a tariff of 100% on all imported semiconductor microchips but added the caveat that chip tariffs will be waived for any company that “builds in the US”. For their part, tech companies have promised huge swaths of investment cash in the future for US-based manufacturing, spearheaded by Apple (AAPL), which has pinky-promised to invest up to $600B in US business development at some point in the next five years or so. Apple shares rose 4.5% on Friday, testing $230.00 per share.
There’s a chance that Trump’s tariffs could hit fast and early in the Gold market in particular. XAU/USD prices, which were already climbing ahead of Donald Trump’s tariff deadline, rose above $3,400 per ounce on Thursday after the Financial Times reported that some of the Trump tariffs could impose a levy on imported Gold bars, and could reach back and include pre-tariff sales that occurred between April and August.
Read more stock news: Trade Desk stock flails following CFO exit
Dow Jones daily chart
Economic Indicator
Consumer Price Index (YoY)
Inflationary or deflationary tendencies are measured by periodically summing the prices of a basket of representative goods and services and presenting the data as The Consumer Price Index (CPI). CPI data is compiled on a monthly basis and released by the US Department of Labor Statistics. The YoY reading compares the prices of goods in the reference month to the same month a year earlier.The CPI is a key indicator to measure inflation and changes in purchasing trends. Generally speaking, a high reading is seen as bullish for the US Dollar (USD), while a low reading is seen as bearish.
Read more.Next release: Tue Aug 12, 2025 12:30
Frequency: Monthly
Consensus: 2.8%
Previous: 2.7%
Source: US Bureau of Labor Statistics
The US Federal Reserve (Fed) has a dual mandate of maintaining price stability and maximum employment. According to such mandate, inflation should be at around 2% YoY and has become the weakest pillar of the central bank’s directive ever since the world suffered a pandemic, which extends to these days. Price pressures keep rising amid supply-chain issues and bottlenecks, with the Consumer Price Index (CPI) hanging at multi-decade highs. The Fed has already taken measures to tame inflation and is expected to maintain an aggressive stance in the foreseeable future.
Author

Joshua Gibson
FXStreet
Joshua joins the FXStreet team as an Economics and Finance double major from Vancouver Island University with twelve years' experience as an independent trader focusing on technical analysis.


