Dow Jones Industrial Average finds little headroom on uneasy Wednesday
- Dow Jones catches chart friction near 42,200 as investors waver.
- Precursor jobs data to Friday’s upcoming NFP surprised to the upside.
- Geopolitical concerns cap gains as investors pivot to watching the Middle East.

The Dow Jones Industrial Average (DJIA) is caught in a bit of a sideways trap in the first week of October as geopolitical concerns weigh on risk appetite. Investors are jostling for position ahead of Friday’s bumper print of US Nonfarm Payrolls (NFP) jobs data with future rate moves from the Federal Reserve (Fed) potentially riding on labor figures.
US ADP Employment Change figures for September rose higher and faster than most market participants expected, clocking in at 143K net new job additions over the month. Median markets forecasts called for a jump to 120K compared to August’s revised print of 103K. Despite the firm upshot in advance jobs numbers, investors will be waiting for the final call on official advance figures on NFP Friday.
Fed Chair Jerome Powell warned that September’s outsized 50 bps rate cut shouldn’t be a signal that further extreme rate moves are on the way. The Fed’s own SEP outlook on rate cuts sees only another 50 bps in total over the next few meetings. Rate markets have fallen in-line with the Fed’s own outlook for the most part; according to the CME’s FedWatch Tool, rate traders see 60% odds of a follow-up 25 bps rate cut in November, with the remaining 40% still hoping for a repeat jumbo cut for 50 bps.
On top of the global market’s outlook on Fed rate cuts, the outlook on domestic manufacturing has evolved into a shaky prospect with a port worker strike across most of the East and Gulf Coasts hampering the movement of physical goods. Middle East tensions are also spilling over following Iran’s missile strike against Israel in retaliation for Israel’s incursion into Lebanon recently. Investors are waiting to see how Israel will respond to the direct confrontation.
Dow Jones news
Despite a wobbly start to the US market session, the Dow Jones is testing into the green on Wednesday. The midweek trading window has the DJIA roughly equally-balanced, with around half of the index’s constituent securities rising for the day. Salesforce (CRM) is rebounding from a recent plunge, climbing 4% on Wednesday to test $282 per share.
On the low end, Nike (NKE) has extended a near-term plunge, sinking over 6% and backsliding to under $84 per share as the shoe manufacturer battles a gloomy outlook. Nike reported a wide miss of earnings expectations in the first quarter of 2024, and the company’s CEO transition has rattled investors.
Dow Jones price forecast
The Dow Jones is in a rough technical consolidation zone between 42,400 and 42,200 on daily candlesticks as buyers grapple with an index planted far too deep into bull country with little technical rebound. The Dow Jones’ last swing low into the 40,000 handle in early September and subsequent 6.6% bottom-to-top rally has left price action in overbought territory, and short pressure will be looking for a snap back to the 50-day Exponential Moving Average (EMA) rising into 41,100.
Dow Jones daily chart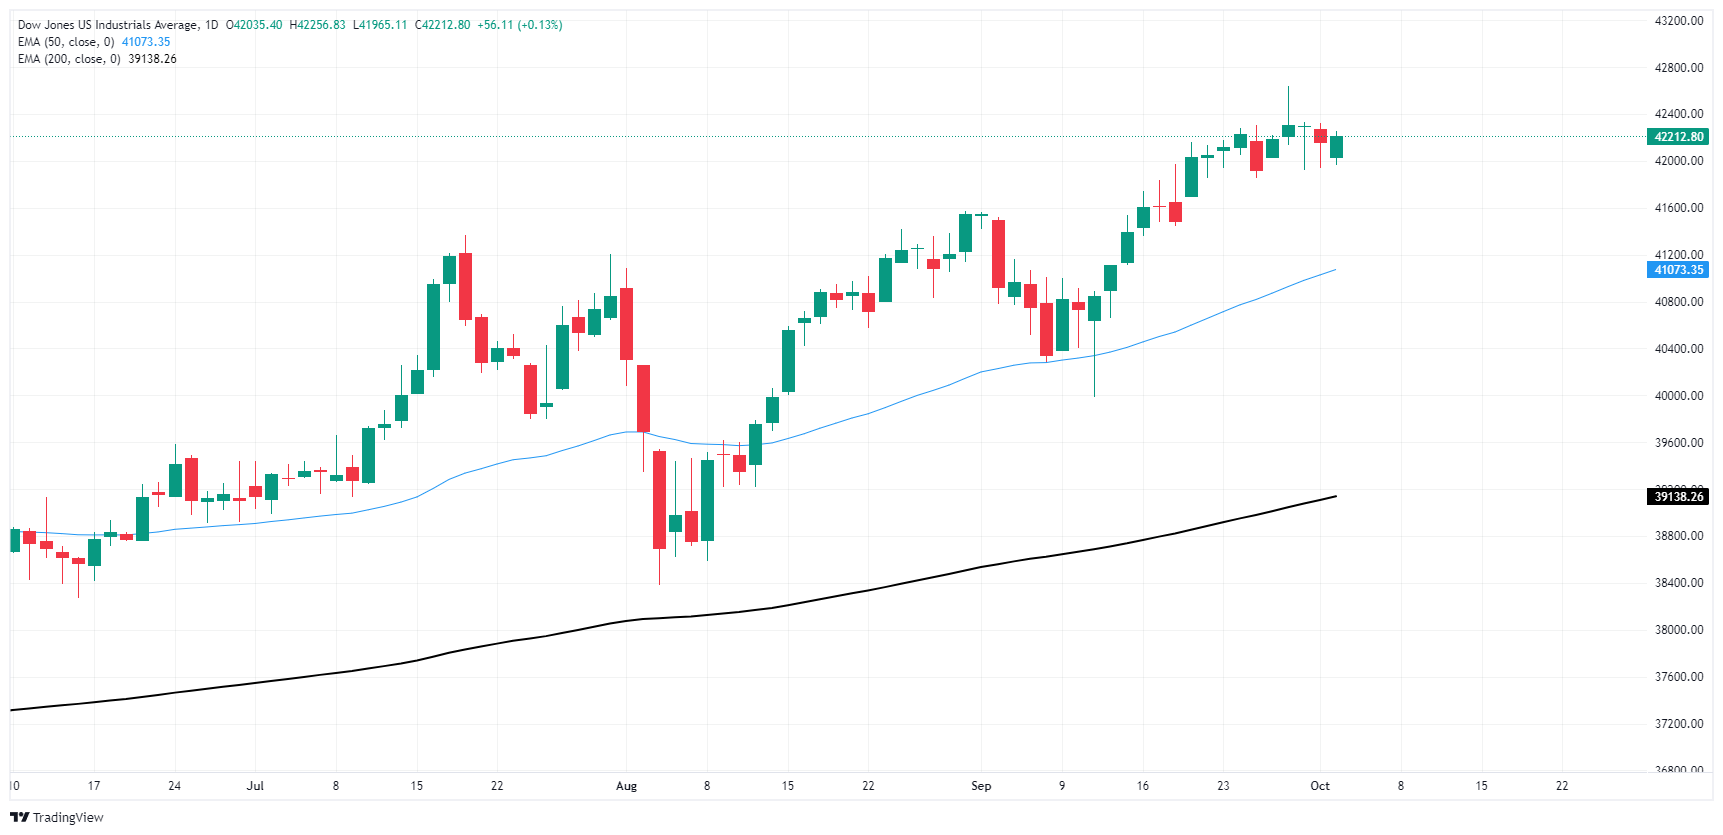
Dow Jones FAQs
The Dow Jones Industrial Average, one of the oldest stock market indices in the world, is compiled of the 30 most traded stocks in the US. The index is price-weighted rather than weighted by capitalization. It is calculated by summing the prices of the constituent stocks and dividing them by a factor, currently 0.152. The index was founded by Charles Dow, who also founded the Wall Street Journal. In later years it has been criticized for not being broadly representative enough because it only tracks 30 conglomerates, unlike broader indices such as the S&P 500.
Many different factors drive the Dow Jones Industrial Average (DJIA). The aggregate performance of the component companies revealed in quarterly company earnings reports is the main one. US and global macroeconomic data also contributes as it impacts on investor sentiment. The level of interest rates, set by the Federal Reserve (Fed), also influences the DJIA as it affects the cost of credit, on which many corporations are heavily reliant. Therefore, inflation can be a major driver as well as other metrics which impact the Fed decisions.
Dow Theory is a method for identifying the primary trend of the stock market developed by Charles Dow. A key step is to compare the direction of the Dow Jones Industrial Average (DJIA) and the Dow Jones Transportation Average (DJTA) and only follow trends where both are moving in the same direction. Volume is a confirmatory criteria. The theory uses elements of peak and trough analysis. Dow’s theory posits three trend phases: accumulation, when smart money starts buying or selling; public participation, when the wider public joins in; and distribution, when the smart money exits.
There are a number of ways to trade the DJIA. One is to use ETFs which allow investors to trade the DJIA as a single security, rather than having to buy shares in all 30 constituent companies. A leading example is the SPDR Dow Jones Industrial Average ETF (DIA). DJIA futures contracts enable traders to speculate on the future value of the index and Options provide the right, but not the obligation, to buy or sell the index at a predetermined price in the future. Mutual funds enable investors to buy a share of a diversified portfolio of DJIA stocks thus providing exposure to the overall index.
Author

Joshua Gibson
FXStreet
Joshua joins the FXStreet team as an Economics and Finance double major from Vancouver Island University with twelve years' experience as an independent trader focusing on technical analysis.


