Dow Jones Index Elliott Wave technical analysis [Video]
![Dow Jones Index Elliott Wave technical analysis [Video]](https://editorial.fxstreet.com/images/Markets/Equities/DowJones/financial-planning-with-stock-chart-and-pen-17530871.jpg)
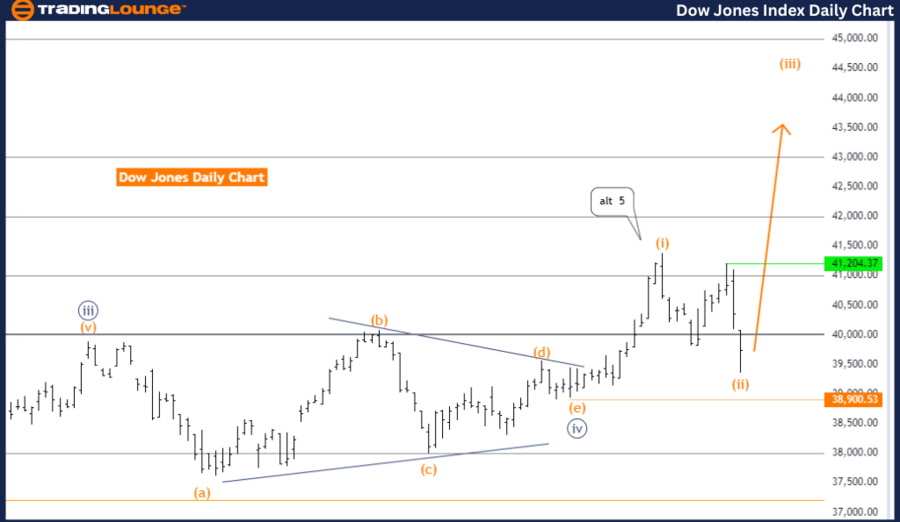
DOW JONES - DJI Elliott Wave Analysis Trading Lounge Day Chart.
Dow Jones - DJI Elliott Wave technical analysis
Function: Trend.
Mode: Impulsive.
Structure: Orange wave 3.
Position: Navy Blue Wave 5.
Direction next lower degrees: Orange wave 4.
Details: Orange wave 2 looking completed, now orange wave 3 is in play. Wave cancel invalid level: 38900.53.
The DOW JONES - DJI Elliott Wave Analysis for the daily chart indicates a market in a trending phase, characterized by an impulsive mode. The primary wave structure identified is orange wave 3, suggesting a strong upward movement. The market is currently positioned within navy blue wave 5, which is a continuation of the overall impulsive trend.
In Elliott Wave theory, wave 3 is typically the most powerful and extended wave, often leading to significant market gains. The analysis notes that orange wave 2 appears to be completed, indicating that the market has finished its corrective phase and is now progressing through orange wave 3. This wave is expected to bring robust bullish momentum to the Dow Jones Industrial Average, aligning with the trend's overall direction.
The completion of orange wave 2 signifies the end of a correction and the start of a strong upward phase. With orange wave 3 in play, the market is anticipated to experience substantial upward movement. Following orange wave 3, the next lower degree wave, orange wave 4, will bring a corrective phase that will temporarily counter the primary trend before resuming its upward trajectory.
The wave cancel invalid level is set at 38900.53. This level is crucial for validating the current wave structure. If the Dow Jones index falls below this level, the existing wave count would be invalidated, meaning the anticipated wave pattern is no longer applicable. In such a case, a reassessment of the market’s direction and wave structure would be necessary.
In summary, the DOW JONES - DJI Elliott Wave Analysis on the daily chart suggests that the market is in the impulsive phase of orange wave 3, positioned within navy blue wave 5. The completion of orange wave 2 indicates a strong upward momentum for the Dow Jones index, with orange wave 3 currently in play. The wave cancel invalid level of 38900.53 is critical for validating the current wave structure, and any breach of this level would require a reassessment of the wave count.
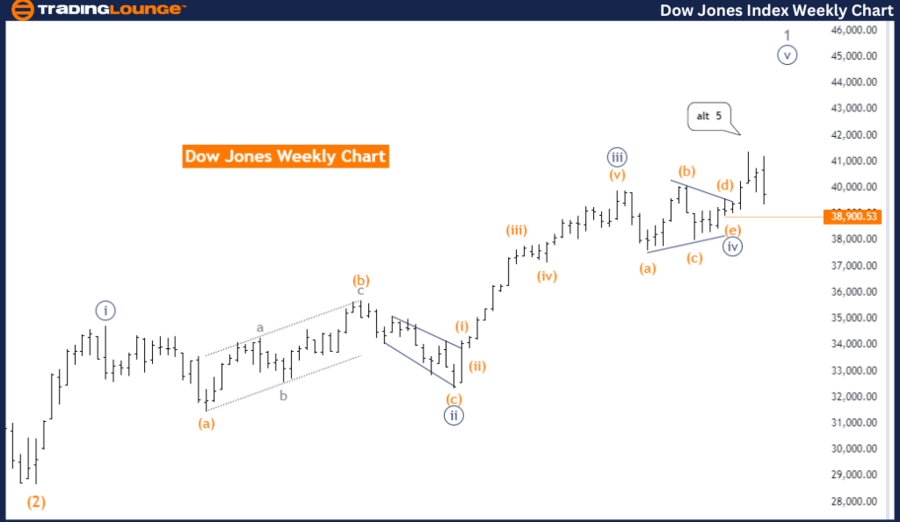
DOW JONES - DJI Elliott Wave Analysis Trading Lounge Weekly Chart.
Dow Jones - DJI Elliott Wave technical analysis
Function: Trend.
Mode: Impulsive.
Structure: Navy Blue Wave 5.
Position: Gray wave 1.
Direction next higher degrees: Navy blue wave 5 (continue).
Details: Navy blue wave 4 looking completed, now navy blue wave 5 is in play. Wave cancel invalid level: 38900.53
The DOW JONES - DJI Elliott Wave Analysis for the weekly chart indicates that the market is in a trending phase characterized by an impulsive mode. The primary wave structure identified is navy blue wave 5, which signals the continuation of a strong upward movement. The current position within this structure is gray wave 1, suggesting the beginning of a new sub-wave within the broader upward trend.
Navy blue wave 4 is noted as being completed, which implies that the market has finished its corrective phase and is now advancing through navy blue wave 5. In Elliott Wave theory, wave 5 is typically the final wave in the impulsive sequence, often leading to the peak of the current trend before a larger corrective phase begins. This suggests that the market is likely to continue its upward trajectory as navy blue wave 5 progresses.
The completion of navy blue wave 4 indicates the end of the previous corrective phase and the start of a new impulsive phase with navy blue wave 5 now in play. This wave is expected to bring further upward movement, potentially driving the market to new highs. Following the completion of navy blue wave 5, a more significant correction could be anticipated.
The wave cancel invalid level is set at 38900.53, which is a critical level for maintaining the validity of the current wave structure. If the Dow Jones index falls below this level, it would invalidate the existing wave count, indicating that the expected wave pattern is no longer applicable. In such a scenario, a reevaluation of the market’s direction and wave structure would be necessary.
In summary, the DOW JONES - DJI Elliott Wave Analysis on the weekly chart suggests that the market is in the impulsive phase of navy blue wave 5, positioned within gray wave 1. The completion of navy blue wave 4 indicates a strong upward momentum with navy blue wave 5 currently in play. The wave cancel invalid level of 38900.53 is crucial for validating the current wave structure, and any breach of this level would require a reassessment of the wave count.
Technical analyst: Malik Awais.
Dow Jones - DJI Elliott Wave technical analysis [Video]
Author

Peter Mathers
TradingLounge
Peter Mathers started actively trading in 1982. He began his career at Hoei and Shoin, a Japanese futures trading company.


