Dow Jones Elliott Wave technical analysis [Video]
![Dow Jones Elliott Wave technical analysis [Video]](https://editorial.fxsstatic.com/images/i/Equity-Index_DJI-2.jpg)
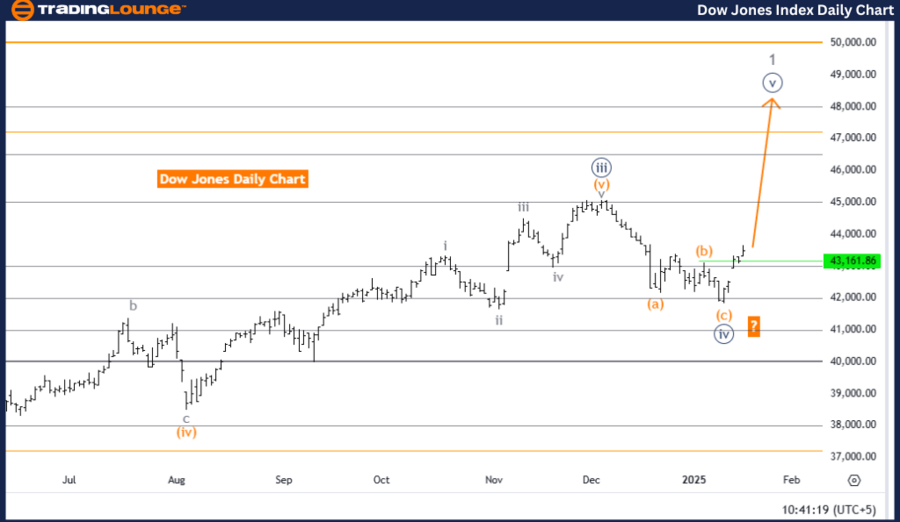
DOW JONES - DJI Elliott Wave Analysis Trading Lounge day chart.
DJI Elliott Wave technical analysis
Technical analysis overview
-
Function: Bullish Trend.
-
Mode: Impulsive.
-
Structure: Navy Blue Wave 5.
-
Position: Gray Wave 1.
-
Direction next higher degrees: Navy Blue Wave 5 (Started).
-
Details: Navy Blue Wave 4 appears complete, with Navy Blue Wave 5 currently in play.
-
Wave cancel invalid level: 41822.71.
The Dow Jones daily chart illustrates a bullish trend within the Elliott Wave framework, characterized by an impulsive mode. The current wave structure features navy blue wave five, which continues the upward momentum following the completion of navy blue wave four. This movement signals the beginning of a new phase in the broader bullish trend.
At this stage, the wave position corresponds to gray wave one, marking the early phase of the upward progression within navy blue wave five. This development indicates a strong directional movement as the market progresses through this impulsive phase.
The wave count's invalidation level is set at 41822.71, meaning any movement below this threshold would invalidate the current wave structure and require a reassessment of the analysis. As long as the price stays above this critical level, the bullish wave structure remains intact, with navy blue wave five expected to advance further.
This phase is crucial in the Elliott Wave sequence, as navy blue wave five is likely to push the market to new highs, aligning with the prevailing bullish trend. Monitoring price action and wave progression closely will be essential to confirm the continuation and completion of this impulsive wave.
Conclusion
In summary, the Dow Jones daily chart indicates a bullish trend led by navy blue wave five, following the completion of navy blue wave four. The wave structure is in its initial stage, represented by gray wave one, and signals potential further upward movement. The invalidation level of 41822.71 serves as a key reference point to maintain the wave count's validity. As the market evolves, this impulsive phase is expected to reinforce the continuation of the overall bullish trend.
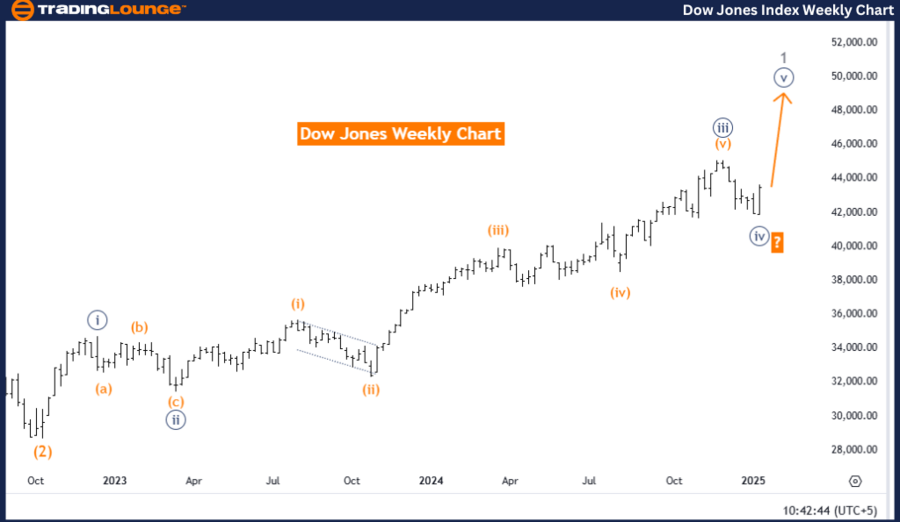
DOW JONES - DJI Elliott Wave analysis trading lounge weekly chart
DJI Elliott Wave technical analysis
Technical analysis overview
-
Function: Bullish Trend.
-
Mode: Impulsive.
-
Structure: Navy Blue Wave 5.
-
Position: Gray Wave 1.
-
Direction next higher degrees: Navy Blue Wave 5 (Started).
-
Details: Navy Blue Wave 4 appears complete, with Navy Blue Wave 5 currently in play.
-
Wave cancel invalid level: 41822.71.
The Dow Jones weekly chart highlights a bullish trend within the Elliott Wave framework, exhibiting an impulsive mode. The wave structure is currently defined by navy blue wave five, signaling a continuation of upward momentum after the completion of navy blue wave four. This phase suggests the beginning of significant growth within the broader market trend.
At this stage, the wave position is identified as gray wave one, which represents the initial phase of navy blue wave five. This progression marks the early stages of a new impulsive movement, reinforcing the overall bullish outlook. The continued development of navy blue wave five is in line with expectations for further upward market expansion.
The invalidation level for the wave count is set at 41822.71, meaning that any price movement below this level would invalidate the current wave count and require a revised analysis. As long as the price remains above this level, the bullish wave structure remains valid and intact.
This phase represents a critical juncture in the Elliott Wave sequence as the market progresses within navy blue wave five. Monitoring price action and wave formation closely will be essential to confirm the ongoing bullish momentum and the successful completion of this impulsive phase.
Conclusion
In summary, the Dow Jones weekly chart demonstrates a bullish trend led by the development of navy blue wave five, following the completion of navy blue wave four. The current position within the sequence is gray wave one, marking the beginning of an upward progression. The invalidation level of 41822.71 serves as a crucial reference point to maintain the validity of the wave count. As navy blue wave five unfolds, further upward movement is anticipated, reinforcing the continuation of the broader bullish trend.
Dow Jones Elliott Wave technical analysis [Video]
Author

Peter Mathers
TradingLounge
Peter Mathers started actively trading in 1982. He began his career at Hoei and Shoin, a Japanese futures trading company.